Mash-Up

It is generally acknowledged that consumers’ propensity to spend varies by age, as do the types of products they purchase. Age-wise, Millennials are on the cusp of what experts deem to be the sweet-spot for spending—setting up homes, starting a family, and so on—but that’s just not typically been the reality.

Burdened by student debt, many in this age group spend money primarily on mobile devices and media content. They are champions of the sharing economy and sustainability, con­tent to rent rather than own everything from special occasion apparel and jewelry to cars. The research aligns: 18- to 34- year-old respondents are more likely than any other group to consider on-demand video streaming untouchable—42 percent, compared with 29 percent of 35- to 54-year-olds. They also are less apt to give up their daily cup of gourmet coffee, their gym membership, and their costume jewelry as compared with other adults.

“Millennials are now the largest generation of potential shoppers and they have certain traits that are shaping their buy­ing habits. They’ve lived through the Great Recession and it has had an effect on them: They tend to be frugal,” says Paula Rosenblum, co-founder and managing partner at RSR Research. “If you ask them if purchasing jeans is expendable, they’ll say ‘Sure,’ because they can buy another pair from H&M for $20. This generation has grown up with fast fashion; and when you are buying from those types of retailers, everything becomes expendable.”

Rosenblum is quick to point out that although Millenni­als may be frugal, they are interested in quality, as exemplified by their desire to have the latest smartphone and a willing­ness to invest in items that inspire and speak to their social consciousness. “Part of the reason why department stores and some specialty retailers are in a world of hurt is because Millennials don’t want to go into stores and wander; and they definitely don’t want to wear logos emblazoned on their chest. They favor curated assortments that are in line with who they are.” As a result, some long-established retailers “are going to have to find a way to reinvent themselves if they expect to return to relevancy,” states Rosenblum.

Source: Barry Berman, Joel R Evans, Patrali Chatterjee (2017), Retail Management: A Strategic Approach, Pearson; 13th edition.

Older and Wiser?

Baby Boomers and beyond are obviously in a somewhat dif­ferent frame of mind when it comes to determining what’s expendable and untouchable. Having spent years amassing stuff, they’d prefer to spend money on an experience. Organic and gourmet foods are off the table for the 55 and older crowd, with 87 and 93 percent checking the expendable box on these potential purchases, respectively. And although this age group is a target market for the makers of anti-aging products, a commanding 92 percent say they can live without high-end cosmetics.

There is a silver lining: Among consumers age 55 and older, 45 percent designate charitable contributions as untouch­able. When they dine out, they tend to favor casual sit-down restaurants such as Applebee’s, TGI Friday’s, and Ruby Tues­day. (It helps that some of these places offer special senior dis­counts.) This age group is also more inclined than any other to consider their vacations to be something they can’t live without. That’s not surprising when you consider how spread out fami­lies tend to be today; traveling is one way to reconnect with the grandkids.

Older consumers are in sync with the younger generation when it comes to Internet service. In fact, 87 percent cite their connection as untouchable, which might have something to with live chatting with grandkids and monitoring retirement funds. However, 62 percent of older consumers say that basic cable television is something they can’t live without (while many Millennials are turning to streaming media for their enter­tainment, sports, etc.); 33 percent have the same feeling for premium cable or satellite television. It appears that once you reach age 55, the lion’s share of entertainment takes place in the living room recliner, remote in hand—83 percent of these con­sumers deem movie/theater tickets to be expendable for them.

Source: Barry Berman, Joel R Evans, Patrali Chatterjee (2017), Retail Management: A Strategic Approach, Pearson; 13th edition.

Tracking Trends

Digging into the research by household income and gender yields interesting insights. Among consumers with a house­hold income of $150,000 or more, 53 percent indicate that hav­ing their hair cut or colored is an untouchable item—a greater percentage than any other income or age group; 21 percent say maid service is untouchable; and 22 percent feel the same way about lawn care service. One might expect that more affluent consumers would be further inclined to consider fine dining untouchable, but that’s not the case. Their propensity to spend on fine dining is actually on par with other income segments; they also don’t show a particular proclivity for shopping at department or specialty stores. See Table 4.

The one category that stands out among this income group is the vacation. On average, 34 percent of all respondents con­sider it to be untouchable; the percentage jumps to 36 percent for the 55-and-older group, but for those with a household income of $150,000 and up, 50 percent refuse to give up their vacation time. Perhaps the most telling indicator of how well- heeled consumers are feeling about spending in the near future is the feedback provided to the question, “Have you cut back on any of the items [included in the survey]?” Slightly more than 7 out of every 10 respondents (71 percent) answered “no.”

Source: Barry Berman, Joel R Evans, Patrali Chatterjee (2017), Retail Management: A Strategic Approach, Pearson; 13th edition.

Gender Trends

The differences between men’s and women’s perception of what’s expendable or untouchable are generally not dramatic, but they can be eye-opening: 16 percent of men consider gour­met food untouchable; only 11 percent of women feel the same way. Then again, it would be interesting to determine how each defines “gourmet.” Nearly 40 percent of men cite a haircut as untouchable; among women, 45 percent say taking care of their hair is something they’re not willing to forego. Women are more inclined to feel that charitable contributions are untouchable; men are more likely to consider a new pair of jeans to be an item they can’t live without.

The research provides a curious snapshot of gender dif­ferences when it comes to dining outside the home. Men and women are on the same page regarding eating at fast-casual restaurants such as Panera Bread; but men are more likely to view both fine dining and casual sit-down establishments such as Applebee’s as untouchable. When it comes to fast food, 71 percent of women feel it’s expendable. Men are not quite as willing to give up their Big Mac and fries; 34 percent say there’s no way they’ll give up their fast-food fix.

Some of the greatest discrepancies between men and women are apparent in the responses provided when asked about changes they’ve made recently. Nearly 4 in 10 women feel they’ve become more practical and realistic in their pur­chases; and 46 percent indicate that they focus more on what they need rather than what they want. That’s in sharp contrast to how men responded; 33 percent say they’ve become more practical and 34 percent focus more on needs than wants.

The challenge for retailers is trying to make sense of all of these data and make the most of this moment in time. Reading between the lines, it’s clear that regardless of age, income, or gender, consumers do not appear to have strong ties to stores or brands compared to the past. They’re looking for value and they take some pride in being thrifty—except when they’re upgrading their smartphone, in which case, all budget bets are off.

Source: Barry Berman, Joel R Evans, Patrali Chatterjee (2017), Retail Management: A Strategic Approach, Pearson; 13th edition.

Retail Consumer Demographics and Lifestyles

Demographics are objective, quantifiable, easily identifiable, and measurable population data. Lifestyles are ways in which individual consumers and families (households) live and spend time and money. Visit our Web site (www.bermanevansretail.com) for posts on these topics.

1. Consumer Demographics

Consumers, both as groups and as individuals, can be identified by such demographics as gender, age, population growth rate, life expectancy, literacy, language spoken, household size, marital and family status, income, retail sales, mobility, place of residence, occupation, education, and ethnic/racial background. These factors affect retail shopping and retailer actions.

A retailer should have some knowledge of overall trends, as well as the demographics of its own target market. Table 7-1 indicates broad demographics for 10 nations around the world, and Table 7-2 shows U.S. demographics by region. Regional data are useful since most retailers are local and regional.

In understanding U.S. demographics, it is helpful to know these facts:

  • The typical household has an annual income of $54,000, according to the Federal Reserve. The top one-fifth of households earns approximately $100,000 or more; the lowest one-fifth earns approximately $20,000 or less.2 If income is high, people are apt to have discretionary income—money left after paying taxes and buying necessities.
  • About 12 percent of people move each year; two-thirds of all moves are in the same county.
  • There are about 6.5 million more U.S. females than males; 57 percent of adult females are in the labor force.3
  • Most U.S. employment is in services. In addition, there are now more professionals and white-collar workers than before and fewer blue-collar and agricultural workers.
  • Approximately 32 percent of all U.S. adults age 25 and older have at least a 4-year college degree.4
  • The population comprises many ethnic and racial groups. African Americans, Hispanic Americans, and Asian Americans account for one-third of U.S. residents—a steadily rising figure. Each of these groups represents a large potential target market; their total annual buying power is more than $3.4 trillion.5

Although the preceding gives an overview of the United States, demographics vary by area (as Table 7-2 indicates). Within a state or city, some locales have larger [or smaller] populations and more [or less] affluent, older [younger], and better-educated [or less-educated] residents.

Because most retailers are local or operate in only part of a region, they must compile data about the people living in their trading areas and those most apt to shop there. For a given business and location, the characteristics of the target market (the customer group to be sought by the retailer) can be studied on the basis of some combination of these demographic factors—and a retail strategy planned accordingly:

Market size. How many people are in the potential target market?

  • Is the potential target market more male or female, or are they equal in proportion?
  • What are the prime age groups to which the retailer wants to appeal?
  • Household size. What is the average household size of potential consumers?
  • Marital and family status. Are potential consumers single or married? Do families have children?
  • Is the potential target market lower income, middle income, or upper income? Is discretionary income available for luxury purchases?
  • Retail sales. What is the area’s sales forecast for the retailer’s goods/services category?
  • How important is the birthrate for the retailer’s goods/services category?
  • Mobility. What percent of the potential target market moves into and out of the trading area yearly?
  • Where people live. How large is the trading area from which potential customers can be drawn?
  • Employment status. Does the potential target market include working women?
  • In what industries and occupations are people in the area working? Are they professionals, office workers, or of some other designation?
  • Education. Are potential customers college educated?
  • Ethnic/racial background. Does the potential target market cover a distinctive racial or ethnic group?

2. Consumer Lifestyles

Consumer lifestyles are based on social and psychological factors and are influenced by demo­graphics. As with demographics, a retailer should first have some knowledge of consumer lifestyle concepts and then determine the lifestyle attributes of its own target market.

These social factors are useful in identifying and understanding consumer lifestyles.

  • A culture is a distinctive heritage shared by a group of people that passes on a series of beliefs, norms, and customs. The U.S. culture stresses individuality, success, education, and material comfort; there are also various subcultures (such as African-, Asian-, and Hispanic-Americans) due to the many countries from which residents have come.
  • Social class involves an informal ranking of people based on income, occupation, education, and other factors. People often have similar values in each social class.
  • Reference groups, of which there are several types, influence people’s thoughts and behav­ior. For example, a group that someone wishes she or he belonged to but does not is called an aspirational group; a group that a person does belong to is referred to as a membership group; and a dissociative group is one in which a person belongs but wishes he or she did not.

Face-to-face groups, such as families, have the most impact. In reference groups are opinion leaders whose views are respected and sought.

  • The family life cycle describes how a traditional family moves from bachelorhood to children to solitary retirement. At each stage, attitudes, needs, purchases, and income change. Retailers must also be alert to the many adults who never marry, divorced adults, single-parent families, and childless couples. The household life cycle incorporates life stages for both family and nonfamily households.
  • Time utilization refers to activities in which a person engages and the time allocated to them. The broad categories are work, transportation, eating, recreation, entertainment, parenting, sleeping, and (retailers hope) shopping. Today, the number of dual-earner households continues to increase; many people have multiple jobs to maintain the rise in standards of living. This affects retailers in that consumers have less discretionary time and therefore allocate less time to shopping.

These psychological factors help in identifying and understanding consumer lifestyles:

  • A personality is the sum total of an individual’s traits, which make that individual unique. Traits include a person’s level of self-confidence, innovativeness, autonomy, sociability, emo­tional stability, and assertiveness.
  • Class consciousness is the extent to which a person desires and pursues social status. It helps determine the use of reference groups and the importance of prestige purchases. A class­conscious person values the status of goods, services, and retailers.
  • Attitudes (opinions) are the positive, neutral, or negative feelings a person has about differ­ent topics. Attitudes are also feelings consumers have about a given retailer and its activities. Does the consumer feel a retailer is desirable, unique, and fairly priced?
  • Perceived risk is the level of risk a consumer believes exists regarding the purchase of a specific good or service from a given retailer, whether or not the belief is correct. There are six types: functional (Will a good or service perform well?); physical (Can a good or service hurt me?); financial (Can I afford it?); social (What will peers think of my shopping here?); psychological (Am I doing the right thing?); and time (How much shopping effort is needed?). Perceived risk is high if a retailer or its brands are new, a person is on a budget or has little experience, there are many choices, and an item is socially visible or complex. See Figure 7-3. Firms can reduce perceived risk with information.
  • The importance of a purchase to the consumer affects the amount of time he or she will spend to make a decision and the range of alternatives considered. If a purchase is important, perceived risk tends to be higher, and the retailer must adapt to this.

A retailer can develop a lifestyle profile of its target market by answering these questions and then using the answers in developing its strategy:

Culture: What values, norms, and customs are important to the potential target market?

  • Social class:Are potential consumers lower, middle, or upper class? Are they socially mobile?
  • Reference groups:To whom do people look for purchasing advice? Does this differ by good or service category? How can a firm target opinion leaders?
  • Family (or household) life cycle:In what stage(s) of the cycle are most potential customers?
  • Time utilization:How do people spend time? How do they feel about their shopping time?
  • Personality:Do potential customers have identifiable personality traits?
  • Class consciousness: Are potential consumers status-conscious? How does this affect purchases?
  • Attitudes:How does the potential target market feel about the retailer and its offerings in terms of specific strategy components?
  • Perceived risk: Do potential customers feel risk in connection with the retailer? Which goods and services have the greatest perceived risk?
  • Importance of the purchase:How crucial are the goods/services offered to potential customers?

3. Retailing Implications of Consumer Demographics and Lifestyles

Demographic and lifestyle factors need to be considered from several perspectives. Here are some illustrations. By no means do the examples cover the full domain of retailing.

GENDER ROLES The many working women who put in 60 to 70 hours or more each week between their job and home responsibilities have altered lifestyles. Compared with women who have not worked outside the home, they tend to be more self-confident and individualistic, more con­cerned with convenience, more interested in sharing household tasks with spouses or significant others, more knowledgeable and demanding, more interested in leisure activities and travel, more involved with self-improvement and education, more appearance-conscious, and more indifferent to small price differences among retailers. They are less interested in unhurried shopping.

Due to the number of working women, male lifestyles are also changing. More men now take care of their children, shop for food, do laundry, wash dishes, cook, vacuum, and clean the bath­room. Male grocery and mass merchandise shoppers in the United States are steadily increasing, especially with Millennials.6 The generational shift from traditional roles is bolstered by mobile E-commerce and millennial men’s savviness with smartphones and shopping apps. In the future, there will be still more changes in men’s and women’s roles. The clout and duties of husbands and wives will be shared more often. Retailers need to appreciate this trend. See Figure 7-4.

CONSUMER SOPHISTICATION AND CONFIDENCE Many shoppers are now more knowledgeable and cosmopolitan; more aware of trends in tastes, styles, and goods and services; and more sophisticated. Nonconforming behavior is accepted when consumers are self-assured and better appreciate the available choices. Confident shoppers experiment more. For example, today, it may be considered an asset to be viewed as “cheap,” which to some shoppers means “smart.” Thus, for example, Ikea offers style at low prices, partly since consumers are responsible for self-assembly of the furniture they buy. Unlike other fashion-based apparel retailers, Zara has little in-store stock and updates its fashion apparel often. These combined strategies motivate Zara customers to visit its stores often. This also encourages shoppers to immediately buy an item since they fear that it may quickly sell out and not be available on subsequent store visits.7

POVERTY OF TIME The increase in working women, the desire for personal fulfillment, the job commute, and the need for some people to have second jobs has led to many consumers feel­ing time-pressured. Retailers can react to time-pressured consumers through various strategies. Included in those strategies are offering pre-wrapped gift items, store pick-up windows for pur­chases ordered on the Web, home delivery of groceries ordered online, in-home delivery and instal­lation of appliances (on one home visit), and longer store hours (including 24/7). See Figure 7-5.

COMPONENT LIFESTYLES In the past, shoppers were typecast, based on demographics and life­styles. It is widely recognized that shopping is less predictable and more individualistic now, and shopper profiling based traditional segmentation strategies may have low predictive ability for a majority of retailers. This shopping profile is more situation-based, hence, the term component lifestyle.

So-called hybrid consumers are increasingly opting both to trade up to premium products for high-involvement, discretionary spending, and to trade down to budget options for low-involvement necessities in various product and service categories.8 Retailers with mid-priced alternatives are losing share in their polarized consumption basket. It becomes increasingly more complicated for retailers when consumers mix luxury and budget products within the same category. Why will they buy a luxury auto and then go to Costco for replacement tires? Why will they spend several dollars for coffee at Starbucks but feel $1.49 is too high for a fast-food hamburger? The rapid growth of store brands underscores how many retailers are responding by managing a brand portfolio that includes multiple value propositions, such as a generic, a standard, and a premium brand.

4. Consumer Profiles

Considerable research has been aimed at describing consumer profiles in a way that is useful for retailers. Here are three examples:

  • Boston Proper is an online and catalog retailer that appeals to a customer group that is not well served. The retailer’s target market is women aged 35 to 60. It features Bohemian-inspired fashions as well as classy, casual, and sports apparel. When Chico’s acquired Boston Proper in 2011, the retailer operated online and through catalog sales exclusively. Under Chico’s leadership, Boston Proper launched its first stores in 2013 and now has 13 locations in Florida, Georgia, North Carolina, and Texas. Chico’s plans to open hundreds of Boston Proper stores throughout the United States.9
  • About one-sixth of the people who live in the United States self-identify as Hispanic or Latino—up by 2.5 percent from 2010 to 2015, compared to the 2005 to 2010 figure of 51 million people. Hispanic women will make up about 30 percent of the total U.S. female population by 2060. This group is especially important because it represents close to one-fifth of the total women’s fashion-based footwear market, according to research by NPD Group. One strategy used by retailers seeking to attract this market is to use Hispanic celebrities in product branding. Television star Sofia Vergara, on Forbes’s list of the wealthiest women, helped launch a product line for Kmart. Similarly, Latina singer Thalia was involved in a Macy’s brand launch.10
  • Claritas Prizm segmentation system for marketing (owned by the Nielsen Company) divides American households into various lifestyle categories. These are the four wealthiest groups: (1) Upper crust—America’s wealthiest lifestyle consisting of opulent empty-nesting couples over the age of 50. (2) Networked neighbors—The nation’s second wealthiest lifestyles represent­ing suburban wealth. This group embraces technology. (3) Movers and shakers—Dual-income couples who are highly educated, typically between the ages of 45 and 64. Many of these group members are business professionals. (4) Young digerati—Tech-savvy individuals who reside in fashionable urban neighborhoods and love trendy restaurants and clothing boutiques.11

Source: Barry Berman, Joel R Evans, Patrali Chatterjee (2017), Retail Management: A Strategic Approach, Pearson; 13th edition.

Retail Consumer Needs and Desires

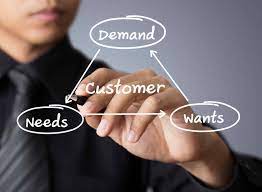
When deriving a target market profile, a retailer should identify key consumer needs and desires. To a retailer, needs are a person’s basic shopping requirements consistent with his or her present demographics and lifestyle. Desires are discretionary shopping goals that affect attitudes and behav­ior. A person may need a new car to get to and from work, and he or she might seek a dealer with Saturday service hours. A person may desire a Porsche and a free loaner car when the vehicle is serviced but be satisfied with a Toyota that can be serviced on weekends and fits within a budget.

When a retail strategy aims to satisfy consumer needs and desires, it appeals to consumer motives, or the reasons for their behavior. These are just a few of the questions to resolve:

  • How far will customers travel to get to the retailer? How important is convenience?
  • What hours are desired? Are evening and weekend hours required?
  • What level of customer services is preferred?
  • How extensive a goods/service assortment is desired?
  • What level of goods/service quality is preferred?
  • How important is price?
  • What retailer actions are necessary to reduce perceived risk?
  • Do different market segments have special needs? If so, what are they?

Let’s address the last question by looking at three particular market segments that attract retailer attention: in-home shoppers, online/mobile shoppers, and outshoppers.

  1. In-Home Shopping: The in-home shopper is not always a captive audience. Shopping is often discretionary, not necessary. Convenience in ordering an item, without traveling for it, is important. These shoppers are often active store shoppers as well as affluent, well educated, self-confident, younger, and venturesome. They like in-store shopping but have low opinions of local shopping. Catalog shoppers have more flexible time requirements. In households with young children, in-home shopping is more likely if the woman works part time or not at all than full-time working mothers. In-home shoppers may be unable to comparison shop; may not be able to touch, feel, handle, or examine products firsthand; are concerned about service (such as returns); and may not have a salesperson to answer questions.
  2. Online/Mobile Shopping: People who shop online are often well educated and have above­average incomes (as stated in Chapter 6). As we noted earlier, online shopping encompasses more than just purchasing online. Using the Toys “R” Us Web site, shoppers can research items, check out prices, and place orders. Shoppers can have items shipped to them or can pick them up in-store. The retailer has two strong E-commerce Web sites: Toysrus.com and www.Babiesrus.com. These sites offer customers a large online choice of toys and baby products, provide free shipping on items costing $19 or more, and allow in-store pickup for online purchases. In addition to its Web sites, Toys “R” Us has over 1,600 company-operated stores and an additional 250 licensed stores in 39 countries and jurisdictions.12
  1. Outshopping: Out-of-hometown shopping, outshopping, is important for both local and surrounding retailers. The former want to minimize this behavior, whereas the latter want to maximize it. Outshoppers are often young, members of a large family, and new to the com­munity. Income and education vary by situation. Outshoppers differ in their lifestyles from those who patronize hometown stores. They enjoy fine foods, like to travel, are active, like to change stores, and read out-of-town newspapers. They also downplay hometown stores and compliment out-of-town stores. These are vital data for suburban shopping centers. Outshop- pers have the same basic reasons for out-of-town shopping whether they reside in small or large communities—easy access, liberal credit, store diversity, product assortments, prices, the presence of large chains, entertainment facilities, customer services, and product quality.

Source: Barry Berman, Joel R Evans, Patrali Chatterjee (2017), Retail Management: A Strategic Approach, Pearson; 13th edition.

Shopping Attitudes and Behavior of Retail Consumers

In this section, we look at people’s attitudes toward shopping, where they shop, and the way in which they make purchase decisions. The top of Table 7-3 shows how shoppers around the world say they would change their retail behavior if they needed to reduce their spending; the bottom of the table indicates how global shoppers say they would alter their behavior if they have extra money to spend. Notice the differences among people living in different regions of the world.

1. Attitudes toward Shopping

Research has been done on people’s attitudes and motivations toward shopping. Such attitudes have a big impact on the ways in which people act in a retail setting. Retailers must strive to turn around some negative perceptions that now exist. We will highlight some research findings here.

SHOPPING ENJOYMENT Generally, people today do not enjoy shopping as much as they did before. However, some consumers enjoy shopping and consider it a pleasant experience. Consum­ers who seek relaxation and/or fun while shopping may prefer goods and services associated with higher prices, such as national brands and popular department stores. Although research on the relationship between shopping enjoyment, time spent, and size in the context of physical stores has been ambiguous, perceived shopping enjoyment has a significant positive effect on Web visit duration and purchase conversion.

So, what does stimulate a pleasurable shopping experience—a challenge that retailers must address to increase share of wallet and loyalty? Customers derive shopping enjoyment from their assessment of accessibility and in-store atmospherics that include music, lighting, store design, window displays, visual merchandising, and personnel. Drivers of shopping enjoyment differ by gender—men seek fast, efficient shopping, whereas women often prefer a relaxing atmosphere. In the online retailing environment, use of 3D virtual models, close-up pictures, zoom-in functions, and mix-and-match capabilities enhance the online shopping experience.13

ATTITUDES TOWARD SHOPPING TIME Time pressure and emergency purchase situations are important situational influences that impact retail shopping enjoyment and outcomes. Demo­graphic changes, including the high proportion of dual-income households and the increase in the number of earners managing multiple jobs due to wage stagnation, have contributed to chronic time pressure. Research shows that shoppers are task-oriented, under time pressure, and likely to rely on economic cues such as unit-price data in making product selections.14 Further, retail assort­ment size and complexity can create perceived time pressure when shopping online or in-store. Retailers have often increased their assortments to keep up with changing customer trends and face the challenging tradeoff of whether “more is better” or “less is better” in terms of assortments. Thus, retailers should not only invest more in store atmospherics (such as music, color, lighting, smell, and visual merchandising) but also pay equal attention to the efficiency of store location, parking, and sales personnel assistance that may reduce shoppers’ chronic time pressure.”15

CAUTIOUS OPTIMISM AND DISPARITY IN WEALTH EFFECT There is a disparity in wealth across income tiers. Higher-income consumers are more likely to own stocks; and when their investments gain, they spend more at luxury retailers. Lower-income consumers are less likely to own stocks and the lack of wage growth means that they haven’t seen any improvement in their financial standing over the last several years. For them, memories of the recession linger, which has led to more cautionary spending habits and the propensity to save the extra cash from lower mortgage and energy costs. These consumers have traded down to less expensive brands and shop more at discount stores to secure the most value for their dollar; sometimes, they postpone or forgo discre­tionary big-ticket items. This has led to bifurcated retailing, with high-end and low-end retailers doing better than middle-of-the road retailers.16

WHY PEOPLE BUY OR DO NOT BUY ON A SHOPPING TRIP It is critical for retailers to determine why shoppers leave without making a purchase. Some consumers at online stores place items in their virtual shopping carts but later abandon them, which can lead to lost sales for high-demand, fast-fashion products.17 Research on shopper behavior indicates that shopping goals determine the consumer’s retail journey through both physical and online stores. Shopping goals differ
across consumers and across shopping occasions for each consumer based on the complexity of product purchase, as well as the time horizon within which the purchase decision needs to be made. On some shopping trips, consumers might conduct a goal-directed search to browse and collect information; whereas on other occasions, they might compare items and complete the purchase. On yet other shopping occasions, they might just enjoy experiential browsing or window shopping. Consumers’ shopping goals may also change in response to the shopping environment such as product presentations or demonstrations, sensory stimuli such as smell or music,18 prices, promotions, salesperson interaction, and the behavior of other shoppers in the store.

ATTITUDES BY MARKET SEGMENT There is considerable academic and commercial research on shopper segmentation. Researchers have segmented shoppers in terms of consumer characteristics (geo-demographics and psychographics), purchase quantity/variety/frequency, promotion sensitiv­ity and usage, search behavior, shopping values, multichannel usage behavior, and post-purchase behavior.19 One recent study, examining “smart” shopping activities, identified three smart grocery shopper segments: involved, spontaneous, and apathetic.

Involved shoppers are apt to be Baby Boomers and prioritize saving time and effort, be attracted by retailers that provide good product assortment and price-saving opportunities in the form of sales, coupons, or bulk pricing. They spend more time planning stores to visit, but engage in minimal information search on products and brand alternatives, hence in-store pur­chase activities of hedonic value (sampling, in-store cafe) are essential. Spontaneous shoppers are primarily Baby Boomers and least likely to engage in pre-purchase planning and information search, but they care more about saving time and effort than apathetic shoppers. The majority of apathetic shoppers are Generation Xers, those less likely to be time conscious and more likely to have a low marketplace knowledge. This group holds the inherent belief that they are smart shoppers. Although they are most likely to engage in online pre-purchase information search than the other segments, they are price-conscious but do not plan or respond to in-store promotional stimuli.

ATTITUDES TOWARD PRIVATE BRANDS Many consumers believe private (retailer) brands are as good as or better than manufacturer brands. Private label dollar-based market shares exceed one-sixth of U.S. and Canadian revenues. Although these market shares are less than in Western Europe (where private-label sales are over 30 percent), the majority of American and Canadian consumers have positive perceptions of private-label goods: 75 per­cent of Americans and 73 percent of Canadians view private-label products as a good alterna­tive to national brands; 74 percent of Americans and 66 percent of Canadians state they are a good value; and 67 percent of Americans and 61 percent of Canadians feel they are at parity with national brands on quality.20

2. Where People Shop

Consumer patronage differs sharply by type of retailer. Thus, it is vital for firms to recognize the venues where consumers are most likely to shop and plan accordingly.

Many consumers do cross-shopping, whereby they (1) shop for a product category at more than one retail format during the year or (2) visit multiple retailers on one shopping trip. The first scenario occurs because these consumers feel comfortable shopping at different formats during the year, their goals vary by occasion (they may want bargains on everyday clothes and fashion­able items for weekend wear), they shop wherever sales are offered, and they have a favorite format for themselves and another one for other household members. Visiting multiple outlets on one trip occurs because consumers want to save travel and shopping time. The increased use of retail apps on mobile phones during in-store shopping induces more cross-shopping as retailers compete to deploy geo-targeted promotions that activate at competitors’ stores, which attracts people to visit competitors’ stores. According to a survey by the National Retail Federation, the most planned activity for smartphone users is researching products and comparing prices (38 percent of smartphone owners). The second most planned activity on smartphones (28 percent of smartphone owners) is looking up information, such as location, store hours, and directions.21

Here are some cross-shopping examples:

  • Some supermarket customers also regularly buy items carried by the supermarket at conve­nience stores, full-line department stores, drugstores, and specialty food stores.
  • Some department-store customers also regularly buy items carried by the department store at factory outlets and full-line discount stores.
  • The majority of Web shoppers also buy from catalog retailers, mass merchants, apparel chains, and/or department stores.
  • Cross-shopping is high for apparel, home furnishings, shoes, sporting goods, personal-care items, and motor fuel. Table 7-4 shows cross-shopping for motor fuel purchases.

3. The Consumer Decision Process

Besides identifying target market traits, a retailer should know how people make decisions. This requires familiarity with consumer behavior, which is the process by which people determine whether, what, when, where, how, from whom, and how often to purchase goods and services. Such behavior is influenced by a person’s background and traits.

The decision process must be grasped from two different perspectives: (1) what good or service the consumer is thinking about buying and (2) where the consumer is going to buy that item (if the person opts to buy). A consumer can make these decisions separately or jointly. If made jointly, she or he relies on the retailer for support (information, assortments, and informed sales personnel) over the full decision process. If the decisions are made independently—what to buy versus where to buy—the person gathers information and advice before visiting a retailer and views the retailer merely as a place to buy (and probably more interchangeable with other firms).

In choosing whether or not to buy a given item (what), the consumer considers features, durability, distinctiveness, value, ease of use, and so on. In choosing the retailer to patronize for that item (where), the consumer considers location, assortment, credit availability, sales help, hours, customer service, and so on. Thus, the manufacturer and retailer have distinct challenges: The manufacturer wants people to buy its brand what) at any location carrying it (where). The retailer wants people to buy the product, (http://publications.usa.gov/ not necessarily the manufacturer’s brand (what), at its store or nonstore location (where).

The consumer decision process has two parts: the process itself and the factors affecting the process. There are six steps in the process: stimulus, problem awareness, information search, evaluation of alternatives, purchase, and post-purchase behavior. The consumer’s demographics and lifestyle affect the process. The complete process is shown in Figure 7-6.

The best retailers assist shoppers at each stage in the process: stimulus (online ads), problem awareness (stocking new models), information search (point-of-sale displays and good sales­people), evaluation of alternatives (noticeable differences among products), purchase (acceptance of credit cards), and post-purchase behavior (extended warranties and money-back returns). The greater the role a retailer assumes in the decision process, the more loyal the consumer will be.

Each time a person buys a good or service, he or she goes through a decision process. In some cases, all six steps in the process are utilized; in others, only a few steps are employed. For example, a consumer who has previously and satisfactorily bought luggage at a local store may not use the same extensive process as one who has never bought luggage.

The decision process outlined in Figure 7-6 assumes that the end result is a purchase. How­ever, at any point, a potential customer may decide not to buy; the process then stops. A good or service may be unneeded, unsatisfactory, or too expensive. Before discussing the ways in which retail consumers use the decision process, we explain the entire process.

Stimulus. A stimulus is a cue (social or commercial) or a drive (physical) meant to motivate or arouse a person to act. When a person talks with friends, fellow employees, and others, a social cue is received. The special attribute of a social cue is that it involves an interpersonal, noncommercial source. A commercial cue is a message sponsored by a retailer or some other seller. Ads, sales pitches, and store displays are commercial stimuli. Such cues may not be regarded as highly as social ones by consumers because they are seller-controlled. A third type of stimulus is a physical drive. It occurs when one or more of a person’s physical senses are affected. Hunger, thirst, cold, heat, pain, or fear could cause a physical drive. A potential consumer may be exposed to any or all three types of stimuli. If aroused (motivated), he or she goes to the next step in the process. If a person is not sufficiently aroused, the stimulus is ignored—terminating the process for the given good or service under consideration may solve a problem of shortage or unfulfilled desire. It may be hard to learn why a person is motivated to move from stimulus to problem awareness. Many people shop with the same retailer or buy the same good or service for different reasons; they may not know their own motivation, and they may not tell a retailer their reasons for shopping there or buying a certain item.

Recognition of shortage occurs when a person discovers a good or service should be repur­chased. A good could wear down beyond repair, or the person might run out of an item such as milk. Service may be necessary if a good (such as a car) requires a repair. Recognition of unful­filled desire takes place when a person becomes aware of a good or service that has not been bought before or a retailer that has not been patronized before. An item (such as contact lenses) may improve a person’s lifestyle or self-image in an untried manner, or it may offer new features (such as a voice-activated laptop). People are more hesitant to act on unfulfilled desires. Risks and benefits may be tougher to see. When a person becomes aware of a shortage or an unfulfilled desire, he or she acts only if it is a problem worth solving. Otherwise, the process ends.

Information search. If problem awareness merits further thought, information is sought. An information search has two parts: (1) determining the alternatives that will solve the problem at hand (and where they can be bought) and (2) ascertaining the characteristics of each alternative.

First, the person compiles a list of goods or services that address the shortage or desire being con­sidered. This list does not have to be formal. It may be a group of alternatives the person thinks about. A person with a lot of purchase experience normally uses an internal memory search to determine the goods or services—and retailers—that are satisfactory. A person with little purchase experience often uses an external search to develop a list of alternatives and retailers. This search can involve commer­cial sources such as retail salespeople, noncommercial sources such as Consumer Reports, and social sources such as friends. Second, the person gathers information about each alternative’s attributes. An experienced shopper searches his or her memory for the attributes (pros and cons) of each alternative. A consumer with little experience or a lot of uncertainty searches externally for information.

The extent of an information search depends, in part, on the consumer’s perceived risk regarding a specific good or service. Risk varies among individuals and by situation. For some, it is inconse­quential; for others, it is important. The retailer’s role is to provide enough information for a shopper to feel comfortable in making decisions, thus reducing perceived risk. Point-of-purchase ads, product displays, and knowledgeable sales personnel can provide consumers with the information they need.

When the consumer’s search for information is completed, she or he must decide whether a current shortage or unfulfilled desire can be met by any of the alternatives. If one or more are satisfactory, the consumer moves to the next step in the decision process. The consumer stops the process if no satisfactory goods or services are found.

Evaluation of alternatives. Next, a person selects one option. This is easy if one alternative is better on all features. An item with great quality and a low price is a certain pick over expensive, average-quality ones. Yet, a choice may not be that simple, and the person then does an evalua­tion of alternatives before making a decision. If two or more options seem attractive, the person sets the criteria to evaluate and their importance. Alternatives are ranked and a choice is made.

The criteria for a decision are those good or service attributes considered relevant. They may include price, quality, fit, durability, and so on. The person sets standards for these characteristics and rates each alternative according to its ability to meet them. The importance of each criterion is also set, and attributes are often of differing importance to each person. One person may consider price as most important while another places more weight on quality and durability.

At this point, the person ranks alternatives from most favorite to least favorite and selects one. Sometimes, it is hard to rate attributes because they are technical, intangible, new, or poorly labeled. When this occurs, shoppers often use price, brand name, or store name to indicate quality and choose based on this criterion. After a person ranks alternatives, he or she chooses the most satisfactory one. In situations where no alternative is adequate, a decision not to buy is made.

Purchase act. A person is now ready for the purchase act—an exchange of money or a promise to pay for the ownership or use of a good or service. Important decisions are still made in this step. For a retailer, the purchase act may be the most crucial aspect of the decision process because the consumer is mainly concerned with three factors, as highlighted in Figure 7-7:

  1. Place of purchase: This may be a store or a nonstore location. Many more items are bought at stores than through nonstore retailing, although the latter method is growing quickly. The place of purchase is evaluated in the same way as the good or the service: alternatives are listed, their traits are defined, and they are ranked. The most desirable place is then chosen.

Criteria for selecting a store retailer include store location, store layout, service, sales help, store image, and prices. Criteria for selecting a nonstore retailer include image, service, prices, hours, interactivity, and convenience. A consumer will shop with the firm that has the best combination of criteria, as defined by that consumer.

  1. Purchase terms: These include the price and method of payment. Price is the dollar amount a person must pay to achieve the ownership or use of a good or service. Method of payment is the way the price may be paid (cash, short-term credit, long-term credit).
  2. Availability: This relates to stock on hand and delivery. Stock on hand is the amount of an item that a place of purchase has in stock. Delivery is the time span between placing an order and receiving an item and the ease with which an item is transported to its place of use.

If a person is pleased with all aspects of the purchase act, the good or service is bought. If there is dissatisfaction with the place of purchase, the terms of purchase, or availability, the con­sumer may not buy, although she or he may be satisfied with the item itself.

Post-purchase behavior. After buying a good or service, a consumer may engage in post­purchase behavior, which falls into either of two categories: further purchases or re-evaluation. Sometimes, buying one item leads to further purchases and decision making continues until the last purchase. A car purchase leads to insurance; a retailer using scrambled merchandising may stimulate a shopper to further purchase after the primary good or service is bought.

A person may also re-evaluate a purchase. Is performance as promised? Do actual attributes match the expectations the consumer had? Has the retailer acted as expected? Satisfaction typi­cally leads to contentment, a repurchase when a good or service wears out, and positive ratings to friends. Dissatisfaction may lead to unhappiness, brand or store switching, and unfavorable conversa­tions with friends and negative online postings. The latter situation (dissatisfaction) may result from cognitive dissonance—doubt that the correct decision has been made. A consumer may regret that the purchase was made at all or may wish that another choice had been made. To overcome cognitive dissonance and dissatisfaction, the retailer must realize that the decision process does not end with a purchase. After-care (by phone, a service visit, or E-mail) may be as important as anything a retailer does to complete the sale. When items are expensive or important, after-care takes on greater signifi­cance because the person really wants to be right. Also, the more alternatives from which to choose, the greater the doubt after a decision is made and the more important the after-care. Department stores pioneered money-back guarantees so customers could return items if cognitive dissonance occurred.

Realistic sales presentations and ad campaigns reduce post-sale dissatisfaction because con­sumer expectations do not then exceed reality. If overly high expectations are created, a consumer is more apt to be unhappy because performance is not at the level promised. Combining an honest sales presentation with good customer after-care reduces or eliminates cognitive dissonance and dissatisfaction.

4. Types of Consumer Decision Making

Every time a person buys a good or service or visits a retailer, she or he uses a form of the deci­sion process. The process is often undertaken subconsciously, and a person is not aware of its use. Also, as was shown in Figure 7-6, the process is affected by consumer characteristics. Older people may not spend as much time as younger ones in making some decisions due to experience. Well-educated consumers may consult many information sources—increasingly, the Web—before making a decision. Upper-income consumers may spend less time deciding because they can afford to buy again if they are dissatisfied. In a family with children, each member may have input into a decision, which lengthens the process. Class-conscious shoppers may be interested in social sources, including social media. Consumers with low self-esteem or high perceived risk may use all the steps in detail. People under time pressure may skip steps to save time.

The use of the decision process differs by situation. The purchase of a new home usually means a thorough use of each step in the process; perceived risk is high regardless of the consumer’s background. In the purchase of a fast-food meal, the consumer often skips certain steps; perceived risk is low regardless of the person’s background. There are three types of decision processes: extended decision making, limited decision making, and routine decision making.

Extended decision making occurs when a consumer makes full use of the decision process. Much time is spent gathering information and ranking alternatives—what to buy and where to buy—before a purchase. The potential for cognitive dissonance is great. In this category are expen­sive, complex items with which a person has had little or no experience. Perceived risk of all kinds is high. Items requiring extended decision making include a house, a first car, and life insurance. At any point in the process, a consumer can stop, and for expensive, complex items, this occurs often. Consumer traits (such as age, education, an income) have the most impact.

Because their customers tend to use extended decision making, such retailers as real-estate brokers and auto dealers emphasize personal selling, printed materials, and other communication to provide as much information as possible. A low-key informative approach may be best, so shop­pers do not feel threatened. Various financing options may be offered. In this way, the consumer’s perceived risk is minimized.

With limited decision making, a consumer uses all the steps in the purchase process but does not spend a great deal of time on each of them. It requires less time than extended deci­sion making because a person typically has some experience with both the brand and retailer choice of the purchase. This category includes items that have been bought before but not regularly. Risk is moderate, and the consumer spends some time shopping. Priority may be placed on evaluating known alternatives according to a person’s desires and standards, although information search is vital for some. Items requiring limited decision making include a second car, clothing, a vacation, and gifts. Consumer attributes affect decision making, but the impact lessens as perceived risk falls and experience rises. Income, purchase importance, and motives play strong roles.

This form of decision making is relevant to such retailers as department stores, specialty stores, and nonstore retailers that want to sway behavior and that carry goods and services that people have bought before. The shopping environment and assortment are very important. Sales personnel should be available for questions and to differentiate among brands or models.

Routine decision making takes place when the consumer buys out of habit and skips steps in the purchase process. He or she wants to spend little or no time shopping, and the same brands are usually repurchased (often from the same retailers). This category includes items bought regu­larly. They have little risk due to consumer experience. The key step is problem awareness. When the consumer realizes a good or service is needed, a repurchase is often automatic. Information search, evaluation of alternatives, and post-purchase behavior are unlikely. These steps are not undertaken so long as a person is satisfied. Items involved with routine decision making include groceries, newspapers, and haircuts. Consumer attributes have little impact. Problem awareness almost inevitably leads to a purchase.

This type of decision making is most relevant to such retailers as supermarkets, dry cleaners, and fast-food outlets. For them, the following strategic elements are crucial: a good location, long hours, clear product displays, and, most important, product availability. Ads should be reminder- oriented. The major task is completing the transaction quickly and precisely.

5. Impulse Purchases and Customer Loyalty

Impulse purchases and customer loyalty merit special attention. Impulse purchases arise when consumers buy products and/or brands they had not planned on buying before entering a store, reading a mail-order catalog, seeing a TV shopping show, turning to the Web, and so forth. At least part of consumer decision making is influenced by the retailer. There are three kinds of impulse shopping:

  • Completely unplanned. Before coming into contact with a retailer, a consumer has no intention of making a purchase in a goods or service category.
  • Partially unplanned. Before coming into contact with a retailer, a consumer has decided to make a purchase in a goods or service category but has not chosen a brand or model.
  • Unplanned substitution. A consumer intends to buy a specific brand of a good or service but changes his or her mind about the brand after coming into contact with a retailer.

With the partially unplanned and substitution kinds of impulse purchases, some decisions take place before a person interacts with a retailer. In these cases, a shopper may be involved with extended, limited, or routine decision making. Completely unplanned shopping often relates to routine or limited decision making; there is little or no time spent shopping; the key step is prob­lem awareness.

Traditional store-based strategies to sell impulse goods were to place magazines, gift cards, batteries, and candies near cash registers. This strategy is not as successful as in the past as more consumers are making purchases online or ordering goods for home delivery through grocery lists that do not include these items.22

In studying impulse buying, these are some of the consumer attitudes and behavior patterns that retailers should take into consideration:

  • In-store browsing is positively affected by the amount of time a person has to shop.
  • Some individuals are more predisposed toward making impulse purchases than others.
  • The leading reason given by consumers for impulse shopping is to take advantage of a low price/bargain. Impulse purchases should no longer be viewed of as frivolous behavior— increasingly, it is savvy opportunism. See Figure 7-8.
  • Impulse shopping is affected by how stores are arranged. Old Navy reconfigured many of its stores so shoppers could move through the stores more easily and be exposed to more products.
  • Impulse shopping is influenced by whether consumers believe that discounts are real.
  • Impulse purchasing is not confined to stores. Web-based impulse purchases can be increased through various strategies. These include having an attractive and informative Web site, making it easy to buy items (such as Amazon’s one-click purchasing), offering free shipping, and targeting shoppers based on past purchases, where they live, and media consumption.23

When customer loyalty exists, a person regularly patronizes a particular retailer (store or nonstore) that he or she knows, likes, and trusts. This lets consumers reduce decision making because they do not have to invest time learning about and choosing the retailer from which to purchase. Loyal customers tend to be time-conscious (e.g., shop locally); do not often engage in outshopping; and spend more per shopping trip. In a service setting, such as an auto repair shop, customer satisfaction often leads to shopper loyalty; price has less bearing on decisions. Applying the retailing concept enhances the chances of gaining and keeping customers. This means being customer-oriented, coordinated, value-driven, and goal-oriented. Relationship retailing also helps!

The degree of customer loyalty to retailers can be classified according to five groupings: false loyalty, inertial loyalty, latent loyalty, premium loyalty, and reciprocal loyalty. In false loyalty, customers buy from a retailer only when it is offering special sales or promotions. With inertia loyalty, customers are loyal to a retailer mainly by the convenience of its location for store-based retailers or the ease of ordering and delivery for Web-based retailers. Latent loyal customers are loyal to a retailer, but they are light shoppers. With premium loyalty, people are heavy shoppers and advocates for the retailer among friends and family. The most loyal shoppers are reciprocal loyal. They have a strong relationship with a retailer by being advocates, through high purchase activity and by membership and participation in reward programs.24

Unfortunately, a number of retailers use a one-size-fits-all loyalty program, typically mon­etary rewards to stimulate repeat visits. Price reductions often do not alter long-run purchase behavior for people who desire more personal service or convenience. After buying from a retailer because of a limited-time price reduction, some shoppers are apt to return to their usual retailers. A better strategy to sustain customer loyalty is to offer tailored rewards, based on what particular shoppers desire. Tailored promotions include merchandise and service upgrades, free shipping by online stores, and messages through cell phone apps, as well as being more effective in enhancing customer engagement and loyalty.25

Source: Barry Berman, Joel R Evans, Patrali Chatterjee (2017), Retail Management: A Strategic Approach, Pearson; 13th edition.

Retailer Actions

As noted in Chapter 3, in mass marketing, a firm such as a supermarket or a drugstore sells to a broad spectrum of consumers; it does not really focus efforts on any one kind of customer. In concentrated marketing, a retailer tailors its strategy to the needs of one distinct consumer group, such as young working women; it does not attempt to satisfy people outside that segment. With differentiated marketing, a retailer aims at two or more distinct consumer groups, such as men and boys, with a different strategy mix for each; it can do this by operating more than one kind of outlet (such as separate men’s and boys’ clothing stores) or by having distinct departments grouped by market segment in a single store (as a department store might do). In deciding on a target market approach, a retailer considers its goods/service category and goals, competitors’ actions, the size of various segments, the efficiency of each target market alternative for the particular firm, the resources required, and other factors. See Figure 7-9.

After choosing a target-market method, the retailer selects the target market(s) to which it wants to appeal; identifies the characteristics, needs, and attitudes of the target market(s); seeks to understand how its target customers make purchase decisions; and acts appropriately. The process to devise a target market strategy is shown in Figure 7-10. Next, we present several examples of retailers’ target-market activities.

We now present several examples of retailers’ target market activities.

1. Retailers with Mass Marketing Strategies

Walgreens drugstore chain and Kohl’s Department Stores engage in mass marketing. We will discuss both.

Walgreens Boots Alliance is a global company, with over 13,100 drugstores (Walgreens, Duane Reade, Boots, and Alliance Healthcare) in 11 countries. The firm attracts a broad array of customers. Three-quarters of the U.S. population live within 5 miles of a Walgreens or Duane Reade pharmacy. To attract a broad customer base, Walgreens Boots Alliance has convenient store locations, offers a broad array of consumer goods in addition to pharmacy and health care needs, and has online access. The retailer’s Web sites have an average of 68 million visits per month.26

Kohl’s is a popular general merchandise retailer capitalizing on mass marketing. Key com­ponents of Kohl’s mass marketing approach include: the sale of moderately priced private-label merchandise; exclusive and national brand apparel; and footwear and accessories for women, men, and children. Kohl’s has a consistent merchandise mix across all stores (except for some differences due to meeting regional preferences).27

2. Retailers with Concentrated Marketing Strategies

Next, we will discuss Dollar Tree and Claire’s Stores. Both engage in concentrated marketing.

With the acquisition of Family Dollar, Dollar Tree is the leading operator of discount variety stores in the U.S. with 13,000 stores in 48 states and 5 Canadian providences. Its Dollar Tree stores target lower-middle-income customers in suburban locations. These stores sell all items for $1. Dollar Tree has been adding freezers and coolers to drive customer traffic. Its Family Dollar divi­sion sells general merchandise to a lower-income customer in urban and rural locales. Family Dollar stores offer multiple price points, serving customers as their “neighborhood discount store,” with great values on everyday items and a convenient shopping experience.28

Claire’s Stores, Inc. operates close to 3,000 stores under the Claire’s and Icing brand names. The Claire’s stores specialize in fashionable jewelry and accessories (including earrings, necklaces, bracelets, body jewelry, and rings) for young women, teens, tweens, and kids. The Icing stores sell fashion and hair accessories for women (including jewelry, cosmetics, and watches).29

3. Retailers with Differentiated Marketing Strategies

Last, we’ll focus on Foot Locker, Inc. and Gap Inc. Both engage in differentiated marketing.

Besides its mainstream Foot Locker stores, the parent company (Foot Locker, Inc.) also oper­ates chains geared specially toward women and children. Lady Foot Locker offers athletic foot­wear and apparel brands, as well as casual wear and apparel designed for running, walking, toning, and fitness. Kids Foot Locker carries “the largest selection of brand-name athletic footwear, apparel, and accessories for young athletes. Its stores feature an environment geared to appeal to both parents and children.”30

Gap Inc. applies differentiated marketing through its Gap (“clean, classic clothing and acces­sories to help customers express their individual sense of style”—including Gap, Gap Kids, Baby Gap, Gap Maternity, Gap Body, and GapFit collections); Banana Republic (clothing, shoes, hand­bags, and fashion accessories with detailed craftsmanship and luxurious materials); Old Navy (less-expensive fashions and accessories than the Gap, but highly styled); Athleta (women’s active and fitness apparel); and Intermix (styles from emerging and established designers).31

Source: Barry Berman, Joel R Evans, Patrali Chatterjee (2017), Retail Management: A Strategic Approach, Pearson; 13th edition.

Environmental Factors Affecting Retail Consumers

Several environmental factors influence shopping attitudes and behavior, including:

  • State of the economy
  • Consumer confidence about the future
  • Country of residence (industrialized versus developing)
  • Cost of living in the person’s region or city of residence
  • Rate of inflation (how quickly prices are rising)
  • Infrastructure where people shop, such as traffic congestion, the crime rate, and the ease of parking
  • Price wars among retailers
  • Emergence of new retail formats
  • Emergence of new technologies
  • Trend toward more people working at home
  • Government and community regulations regarding shopping hours, new construction, con­sumer protection, and so forth
  • Evolving societal values and norms
  • Digital presence and convenience of shopping at the retailer’s Web site or mobile app

Although all of these elements may not necessarily have an impact on any particular shopper, they do influence the retailer’s overall target market.

When planning the retail strategy that they offer their customers, companies should consider the customers’ standard of living, including family size; discretionary income after spending for health, recreation, and social services; and consumer confidence in their financial future. Unem­ployment, low wages, crowded living conditions, and physical calamities may bring a drop in the standard of living; and an increase in social benefits and higher wages may bring a rise. The standard of living varies from nation to nation, and international comparisons are sometimes made by analyzing per capita income or any number of other indicators.

Source: Barry Berman, Joel R Evans, Patrali Chatterjee (2017), Retail Management: A Strategic Approach, Pearson; 13th edition.

Information Flows in a Retail Distribution Channel

In an effective retail distribution channel, information flows freely and efficiently among the three main parties: supplier (manufacturer and/or wholesaler), retailer, and consumer. This enables the parties to better anticipate and address each other’s performance expectations. We highlight the flows in Figure 8-2 and describe the information needs of the parties next.

A supplier needs to know different kinds of information. From the retailer, the supplier needs estimates of category sales, inventory turnover rates, feedback on competitors, the level of cus­tomer returns, and so on. From the consumer, the retailer needs to know about attitudes toward given styles and models, the extent of brand loyalty, the willingness to pay a premium for superior quality, and the like.

A retailer also needs to know different kinds of information. From the supplier, the retailer needs advance notice of new models and model changes, training materials for complex products, sales forecasts, justification for price hikes, and so on. From the consumer, the retailer wants to know why people shop with the retailer, what they like and dislike about the retailer, where else people shop, and so on.

And the consumer needs different types of information. From the supplier, the consumer needs assembly and operating instructions, the extent of warranty coverage, where to send a complaint, and so forth. From the retailer, the consumer needs to know how various alternatives compare, where specific merchandise is stocked in the store, the methods of payment accepted, the rain check policy when a sale item is out of stock, and so on.

Retailers often play a crucial role in collecting data for other members of the value delivery chain because they have the most direct contact with shoppers. They can assist other channel members by:

Permitting data to be gathered on their premises. Many research firms like to conduct surveys at shopping centers because of the large and broad base of shoppers.

  • Gathering specific data requested by suppliers, such as how shoppers react to displays.
  • Passing along information on the attributes of consumers buying particular brands and mod­els. Because many credit transactions involve retailer cards, these retailers can link purchases with consumer age, income, occupation, and other factors.

For the best information flows, collaboration and cooperation are necessary—especially between suppliers and retailers. This is not always easy. Managing supply chain systems, processes, and infrastructure and the associated changes to transform legacy store-based opera­tions to omnichannel is complex and difficult. The lack of visibility across supply chain functions, as well as fragmented, incomplete, insufficient data, and/or manual processes of pre-existing systems and infrastructure, are not ideally suited for omnichannel functions. This results in the limited ability of existing retailers to compete effectively with new retailers deploying systems designed for omnichannel operations.

Fortunately, many retailers are working to improve their information-sharing efforts. And as in many aspects of retailing, Walmart is leading the way. Thousands of suppliers have online access to Walmart’s database through its password-protected online Retail Link system, which handles hundreds of thousands of information queries weekly. Retail Link was developed to promote more collaboration in inventory planning and product shipping, and it is a linchpin of Walmart’s information efforts.4

Source: Barry Berman, Joel R Evans, Patrali Chatterjee (2017), Retail Management: A Strategic Approach, Pearson; 13th edition.

Avoiding Retail Strategies Based on Inadequate Information

Retailers may rely on nonsystematic or incomplete ways of gathering information due to time and costs, as well as a lack of research skills. But the results can be devastating. For example:

  • Using intuition. A movie theater charges $10 for tickets at all times. The manager feels that because all patrons are seeing the same movie, prices should be the same for a Monday mati­nee as a Saturday evening. Yet, by looking at data stored in the theater’s information system, she would learn attendance is much lower on Mondays. Because people prefer Saturday evening performances, they will pay $10 to see a movie then. Weekday customers have to be lured, and a lower price is a way to do so.
  • Continuing what was done before. A toy store orders conservatively for the holiday season because prior year sales were weak. The store sells out 2 weeks before the peak of the season, and more items cannot be received in time for the holiday. The owner assumed that last year’s poor sales would occur again. Yet, a consumer survey would reveal a sense of optimism and an increased desire to give gifts.
  • Copying a successful competitor’s strategy. A local bookstore decides to cut the prices of best-sellers to match the prices of com. The local store then loses a lot of money and goes out of business because its costs are too high to match the chain. The firm lost sight of its natural strengths (personal service, a customer-friendly atmosphere, and long-time community ties).
  • Devising a strategy after speaking to a few individuals about their perceptions. A family-run gift store decides to have a family meeting to determine the product assortment for the next year. Each family member gives an opinion, and an overall “shopping list” is then compiled. Sometimes, the selections are right on target; other times, they result in a lot of excess inventory. The family would do better by also attending trade shows and reading industry publications.
  • Automatically assuming that a successful business can easily expand. A Web retailer does well with small appliances and portable TVs. It has a good reputation and wants to add other product lines to capitalize on customer goodwill. However, adding custom furniture yields poor results. The firm did not first conduct research, which would have indicated that people buy standard, branded merchandise via the Web but are reluctant to buy custom furniture that way.
  • Not having a good read on consumer perceptions. A florist cuts the price of 2-day-old flow­ers from $17 to $5 a dozen because they have a shorter life expectancy, but they don’t sell. The florist assumes bargain-hunting consumers will want the flowers as gifts or for floral arrangements. What the florist does not realize (due to a lack of research) is that people perceive the older flowers to be of poor quality. The extremely low price actually turns off customers!

What conclusion should we draw from these examples? Inadequate information can cause a firm to devise and enact a bad strategy. These situations can be avoided by using a well-conceived retail information system and properly executing marketing research.

Source: Barry Berman, Joel R Evans, Patrali Chatterjee (2017), Retail Management: A Strategic Approach, Pearson; 13th edition.

The Retail Information System

Data gathering and analysis should not be regarded as a one-shot resolution of a single retailing issue. They should be part of an ongoing, integrated process. A retail information system (RIS) anticipates the information needs of retail managers; collects, organizes, and stores relevant data on a continuous basis; and directs the flow of information to the proper decision makers.

These topics are covered next: Building and using a retail information system, database management, and gathering information via the UPC (Universal Product Code) and EDI (elec­tronic data interchange).

1. Building and Using a Retail Information System

Figure 8-3 presents a general RIS. A retailer begins with its business philosophy and goals, which are affected by environmental factors (such as competitors and the economy). The philosophy and goals provide guidelines that direct strategic planning. Some aspects of plans are routine and need little re-evaluation. Others are nonroutine and need evaluation each time they arise.

After a strategy is outlined, data must be collected, analyzed, and interpreted. If data already exist, they are retrieved from files. When new data are acquired, files are updated. All of this occurs in the information control center. Based on data in the control center, decisions are enacted.

Performance is fed back to the information control center and compared with pre-set criteria. Data are retrieved from files or further data collected. Routine adjustments are made promptly. Regular reports and exception reports (to explain deviations from expected performance) are shown to the right parties. Managers may react in a way affecting company philosophy or goals (such as revamping a passe image or forgoing short-run profits to buy a new computer system).

All types of data should be stored in the control center for future and ongoing use, and the control center should be integrated with the firm’s short- and long-run plans and operations. Infor­mation should not be gathered sporadically and haphazardly but systematically.

A good RIS has several strengths. Information gathering is organized and company focused. Data are regularly collected and stored so opportunities are foreseen and crises averted. Strategic elements can be coordinated. New strategies can be devised more quickly. Quantitative results are accessible, and cost/benefit analysis can be done. Information is routed to the right personnel. Yet, deploying a retail information system may require high initial time and labor costs, and complex decisions may be needed to set up such a system.

In building a retail information system, a number of decisions have to be made:

  • How active a role should be given to the RIS? Will it be used to proactively search for and distribute any relevant data or will it be used to reactively respond to requests from managers when problems arise? The best systems are more proactive because they anticipate events.
  • Should an RIS be managed internally or be outsourced? Although many retailers engage in RIS functions, some use outside specialists. Either style can work, so long as the RIS is guided by the retailer’s information needs. Several firms have their own RIS and use outside firms for specific tasks (such as conducting surveys or managing networks).
  • How much should an RIS cost? Retailers typically spend 0.5 to 2.5 percent of their sales on an RIS. This lags behind most of the suppliers from which retailers buy goods and services.5
  • How technology-driven should an RIS be? Although retailers can gather data from trade asso­ciations, surveys, and so forth, more firms now rely on technology to drive the information process. With the advent of low-cost personal computers and tablets, inexpensive networks, cloud computing, and low-priced software, technology is easy to use. Even a neighborhood deli can generate sales data by product and offer specials on slow-sellers. See Figure 8-4.
  • How much data are enough? The purpose of an RIS is to provide enough information, on a regular basis, for a retailer to make the proper strategy choices—not to overwhelm retail managers. This means performing a balancing act between too little information and informa­tion overload. To avoid overload, data should be carefully edited to eliminate redundancies.
  • How should data be disseminated throughout the firm? This requires decisions as to who receives various reports, frequency of data distribution, and access to databases. When a firm has multiple divisions or operates in several regions, information access and distribution must be coordinated.
  • How should data be stored for future use? Relevant data should be stored in a way that makes information retrieval easy and allows for adequate longitudinal (period-to-period) analysis.

Larger retailers tend to have a chief information officer (CIO) oversee the RIS. Their informa­tion systems departments often have formal, written annual plans. Computers are used by virtu­ally all firms that conduct information systems analysis, and many firms use the Web for some RIS functions. Further growth in the use of retail information systems is still expected. There are many differences in information systems among retailers, in terms of revenues and retail format.

Thirty-five years ago, most computerized retail systems were used only to reduce cashier errors and improve inventory control. Today, they often form the basis for a retail informa­tion system and are used in surveys, ordering, merchandise transfers between stores, and other tasks. These activities are conducted by both small and large retailers. Most small and medium retailers—as well as large retailers—have computerized financial management systems, analyze sales electronically, and use computerized inventory management systems. Here are illustrations of how retailers are using the latest technology advances to computerize their information systems.

Retail Pro, Inc. markets Retail Pro management information software to retailers. This soft­ware is used at stores around the world. Although popular with large retailers, Retail Pro software also appeals to smaller and specialty retailers due to flexible pricing based on the number of users and stores, the type of hardware, payment fraud protection with its partner Cayan POS, customer personalization, and business optimization technology for an omnichannel strategy.6

MicroStrategy typically works with larger retailers—including about two-thirds of the top 500 retailers in the world—to provide merchandising optimization, loss prevention, and customer insight analytics; mobile technology for customer engagement; sales training; product informa­tion; and store operations and security solutions.7

2. Database Management

In database management, a retailer gathers, integrates, applies, and stores information related to specific subject areas. It is a major element in a retail information system, and may be used with customer databases, vendor databases, product category databases, and so on. A firm may compile and store data on customer attributes and purchase behavior, compute sales figures by vendor, and store records by product category. Each of these would represent a separate database. Among retailers that have databases, most use them for frequent shopper programs, customer analysis, promotion evaluation, inventory planning, trading-area analysis, joint promotions with manufacturers, media planning, and customer communications.

Database management should be approached as a series of five steps:

  1. Plan the particular database and its components and determine information needs.
  2. Acquire the necessary information.
  3. Retain the information in a usable and accessible format.
  4. Update the database regularly to reflect demographic trends, recent purchases, and so forth.
  5. Analyze the database to determine company strengths and weaknesses.

Information can come from internal and external sources. A firm can develop databases internally by keeping detailed records and sorting them. It could generate databases by customer— purchase frequency, items bought, average purchase, demographics, and payment method; by vendor—total retailer purchases per period, total sales to customers per period, the most popular items, retailer profit margins, delivery time, and service quality; and by product category—total category sales per period, item sales per period, retailer profit margins, and the percentage of items discounted.

As retailers align their strategies around customer needs and experiences across multiple channels, the need to extract and integrate high-quality, context-specific information from the big data deluge is paramount. Customer information management providers such as Pitney Bowes, a leader in this field, leverage their expertise and data collected from their multiple clients and industries to facilitate cross-channel and cross-border commerce. Pitney Bowes’ Single Customer View service provides a fully integrated 360-degree view of customers to employees. This is done by converting company-dispersed customer interaction data into integrated databases; adding geodemographic context to customer profiles to uncover timely, actionable insights to help craft memorable customer experiences; dynamically tracking customer lifetime value; improving the efficiency of customer acquisitions; and, in some cases, ensuring compliance with national and international regulations.8

To effectively manage a retail database, these are vital considerations:

  • What are the firm’s database goals?
  • Who will be responsible for data management?
  • What type of information will be collected and produced? What will be its format (images, data files, and so on)? Where do you plan to store the data?
  • Is every database initiative analyzed to see if it is successful?
  • Is there a mechanism to flag data that indicates potential problems or opportunities?
  • Are customer purchases of different items or from different company divisions cross-linked?
  • How will data be communicated?
  • Is there a clear privacy policy that is communicated to those in a database? Are there opt-out provisions for those who do not want to be included in a database?
  • Is the database updated each time there is a customer interaction?
  • Are customers, personnel, suppliers, and others invited to update their personal data?
  • Is the database periodically checked to eliminate redundant files?
  • Roughly how long should the data be retained? Is it permanent? Will it be updated?9

Let’s now discuss two aspects of database management: Data warehousing is a mechanism for storing and distributing information. Data mining and micromarketing are ways in which information can be utilized. Figure 8-5 shows the interplay of data warehousing with data mining and micromarketing.

DATA WAREHOUSING One advance in database management is data warehousing, whereby copies of all the databases in a firm are maintained in one location and are accessible to employees at any locale. A data warehouse is a comprehensive compilation of the data used to support man­agement decision making. According to government sources,

The fundamental attributes of a data warehouse are: Subject-Oriented—A data warehouse is organized around high-level business groupings called subjects [such as sales]. Integrated—The data in the warehouse must be integrated and consistent. If two different source systems store conflicting data, the differences need to be resolved during the process of transforming the source data and loading it into the data warehouse. Time-Variant—A key characteristic distinguishing warehouses is the currency of the data. Operational systems require real-time views of data, while data warehouse applications generally deal with longer term, historical data. They can also provide access to a greater volume of more detailed information over a longer time period. Nonvolatile—Data in the warehouse is read­only; updates or a refresh of the data occur on a periodic incremental or full refresh basis.10

A data warehouse has these components: (1) the data warehouse, where data are actually stored; (2) software to copy original databases and transfer them to the warehouse; (3) interactive software to process queries; and (4) a directory for the categories of data kept in the warehouse.

Data warehousing has several advantages. Executives and other employees are quickly, eas­ily, and simultaneously able to access data wherever they may be. There is more companywide entree to new data when they are first available. Data inconsistencies are reduced by consolidating records in one location. Better data analysis and manipulation are possible because information is stored in one location.

Computerized data warehouses were once costly to build (an average of $2.2 million in the 1990s) and, thus, feasible only for the largest retailers. Rapid progress in Web 2.0 and cloud tech­nologies now makes it possible for startup businesses, especially online-only retailers, to access data warehouse as a service (DWaaS). It is a cloud-based outsourcing model in which DWaaS ser­vice providers such as Google (BigQuery), Microsoft (Azure), and Amazon Web Services (AWS) configure and manage the hardware, software platforms, and resources a data warehouse requires. The small business user uploads its own data and queries it on the Web through application pro­gramming interfaces (APIs), and pays based on usage for the managed service.11 The user has no upfront costs to create, staff to manage, or software or hardware to upgrade, and can easily and quickly scale up from small to large in terms of usage and storage. Oracle, NCR-Teradata, and IBM provide enterprise-level data warehousing, and DWaaS provides the same to mid-size and large firms. Cabela’s, Hudson’s Bay, and 7-Eleven are just a few of the multitude of retailers that use data warehousing.12

Dollar Tree’s Family Dollar (www.familydollar.com) discount stores is one of the retailers positioning itself for long-term growth and developing an efficient collaborative business intel­ligence program with suppliers by using a constantly updated retail data warehousing structure developed by Retail Solutions (RSi, www.retailsolutions.com). Real-time store-level inventory and point-of-sale data at the store/item and category level are provided through a Retail Management Solution after cleansing, validation, and standardization through a single portal to Family Dollar and its suppliers. Family Dollar can analyze performance by store cluster, price point, and product mix, and identify lost sales opportunities. Suppliers can fine-tune forecasting and product allocations, and identify distribution voids (e.g., phantom inventory). The micro-level information provides suppliers with greater understanding of consumer demand. Increased collaboration with Family Dollar lowers inventory-holding costs while providing consumers with the highest service levels.13

DATA MINING AND MICROMARKETING Data mining is the in-depth analysis of information to gain specific insights about customers, product categories, vendors, and so forth. The goal is to learn if there are opportunities for tailored marketing efforts that would lead to better retailer performance. One application of data mining is micromarketing, whereby the retailer uses dif­ferentiated marketing and develops focused retail strategy mixes for specific customer segments, sometimes fine-tuned for the individual shopper.

Data mining relies on special software to sift through a data warehouse to uncover patterns and relationships among different factors. The software allows vast amounts of data to be quickly searched and sorted. That is why many firms, such as supermarkets, have made the financial com­mitment to data mining. The entry of well-funded online players such as Amazon, Google, and others has made the competition for grocery share of wallet even more fierce. Grocery has a distinct advantage over other forms of retail to leverage predictive analytics because consumers typically make frequent shopping trips according to SAS, a provider of business analytics software and services. Frequent-shopper card data help grocers track customer purchases over time and understand a shopper’s evolving buying behavior. By using behavioral analytics and value seg­mentation for multiple shoppers within a single household, combined with demographic data, retailers can create a more complete picture of that household’s needs and habits, personalize the shopping experience with micro-targeted promotions to increase the amount of groceries pur­chased, improve profit margins, and increase consumer satisfaction.14

3. Gathering Information through the UPC and EDI

To be more efficient with their information systems, most retailers rely on the Universal Product Code (UPC) and many now utilize electronic data interchange (EDI).

With the Universal Product Code (UPC), products (or tags attached to them) are marked with a series of thick and thin vertical lines, representing each item’s identification code. An item’s UPC includes both numbers and lines. The lines are “read” by scanners at checkout coun­ters. Cashiers do not enter transactions manually—though they can, if needed. Because the UPC itself is not readable by humans, the retailer or vendor must attach a ticket or sticker to a product specifying its size, color, and other information (if not on the package or the product). Given that the UPC does not include price information, this too must be added by a ticket or sticker.

By using UPC-based technology, retailers can record data instantly on an item’s model num­ber, size, color, and other factors when it is sold, as well as send the data to a computer that monitors unit sales, inventory levels, and so forth. The goals are to produce better merchandising data, improve inventory management, speed transaction time, raise productivity, reduce errors, and coordinate information.

Since its inception more than 40 years ago, UPC technology has improved substantially. It is now the accepted retailing standard. Several billion scans occur every day. The UPC allows all stores in the retail sector to identify products and capture information about them. Stores can control inventory more efficiently, provide a faster and more accurate checkout for customers, and easily gather inventory data for accurate and immediate marketing reports. Virtually every time sales or inventory data are scanned by a computer, UPC technology is involved. More than 200,000 U.S. manufacturers and retailers belong to GS1 US (formerly known as the Uniform Code Council), a group that has taken the lead in setting and promoting inter-industry product identi­fication and communication standards.15 Figure 8-6 shows how far UPC technology has come.

Regular UPC tags may result in errors when scanned by customers for product information lookup and be a disadvantage in mobile commerce. To meet the needs of mobile-centric custom­ers, manufacturers and brand owners are adopting GS1 US Mobile Scan that imprints packages with an imperceptible digital watermark (DWcode), that, when scanned with a smartphone app, is linked to a mobile-optimized Web address. This provides contextual product information provided by the brand. Retailers benefit from faster retail checkout, better supply chain efficiency, and an enhanced in-store experience resulting from more information at product locations in aisles and inventory. Consumers, anywhere in the world, get information transparency by scanning the UPC or package imprinted with a DWcode with their Internet-enabled smartphones. Consumers are then able to see a Web page with real-time, brand-authorized product information, pricing, special offers, instructional videos, rich media, and additional shopping assistance.16

With electronic data interchange (EDI) and Internet electronic data interchange (I-EDI), retailers and suppliers regularly exchange information through their computers with regard to inventory levels, delivery times, unit sales, and so on of particular items. As a result, both parties enhance their decision-making capabilities, better control inventory, and are more responsive to demand. UPC scanning is often the basis for product-related EDI data. Hundreds of thousands of firms around the world (led by U.S.-based firms) use some form of the EDI system. Retailers use EDI to replace paper-based documents such as purchase orders, invoices, inventory reports, shipping notifications, routing requests, and routing instructions to electronic documents sent from one computer system to another instantaneously.

Unlike in some other industries, the supply chain in the retail industry is very complicated, and has to be flexible and responsive to fluctuations in demand levels, which can differ for each SKU (stock-keeping unit); and the number of SKUs may increase each year. A retail supply chain cannot afford occasional order delays or “stock-outs”; this it leads to lost sales and raises the risk of sending customers to the competition. Vendor-managed inventory (VMI) systems, one of EDI’s applications, shorten the replenishment cycle and ensure that accurate and timely information is passed on electronically at every stage of the fulfillment cycle by streamlining direct store delivery and lowering delivery and labor costs. This ensures that customers always get products when they want them (e.g., during promotion events or holidays when demand is very high), yet reduces oversupply when demand wanes. Vendor-managed inventory helps retailers strengthen relation­ships with customers and vendors by reducing check-in times, keeping products stocked consis­tently, and reducing human errors.17

Many retailers now require potential suppliers to have an EDI solution—either their own or via a third-party provider—before they are selected (“onboarded”) as a vendor. Many small and medium-sized suppliers and retailers choose cloud-based, third-party EDI solutions for more flexibility and faster integration, quicker onboarding of suppliers, reduction of operating costs, elimination of manual ordering, and better order management.18 The EDI system is covered further in Chapter 15, along with collaborative planning, forecasting, and replenishment.

Source: Barry Berman, Joel R Evans, Patrali Chatterjee (2017), Retail Management: A Strategic Approach, Pearson; 13th edition.

The Retail Marketing Research Process

Marketing research in retailing entails the collection and analysis of information relating to specific issues or problems facing a retailer. At farsighted firms, marketing research is just one element in a retail information system. At others, marketing research may be the only type of data gathering and processing.

The marketing research process embodies a series of activities: defining the issue or prob­lem to be studied, examining secondary data, generating primary data (if needed), analyzing data, making recommendations, and implementing findings. It is not a single act; rather, it is a systematic process. Figure 8-7 outlines the research process. Each activity is done sequentially. Secondary data are not examined until after an issue or problem is defined. In Figure 8-7, the dashed line around the primary data stage means these data are generated only if secondary data do not yield actionable information. The process is described next.

Issue (problem) definition involves a clear statement of the topic to be studied. What infor­mation does the retailer want to obtain to make a decision? Without clearly knowing the topic to be researched, irrelevant and confusing data could be collected. Here are examples of issue defini­tions for a shoe store. The first one seeks to compare three locations and is fairly structured; the second is more open-ended: (1) “Of three potential new store locations, which should we choose?” (2) “How can we improve the sales of our men’s shoes?”

When secondary data are involved, a retailer looks at data that have been gathered for purposes other than addressing the issue or problem currently under study. Secondary data may be internal (such as company records) or external (such as government reports and trade publica­tions). When primary data are involved, a retailer looks at data that are collected to address the specific issue or problem under study. This type of data may be generated via survey, observation, experiment, and simulation.

Convenience Store News conducted a study of what time of day people most often visit con­venience stores. Its 2016 “Realities of the Aisle” consumer research studied 1,501 people who shopped at least one time in the prior month. By the time you read this, the data in Table 8-1 will be secondary data in nature.19

Secondary data are sometimes relied on; other times, primary data are crucial. In some cases, both are gathered. It is important that retailers keep these points in mind: (1) There is great diver­sity in the possible types of data collection (and in the costs). (2) Only data relevant to the issue being studied should be collected. (3) Primary data are usually acquired only if secondary data are inadequate (thus, the dashed box in Figure 8-7). Both secondary and primary data are described further in the next sections.

These kinds of secondary and primary data can be gathered for the shoe store issues recently stated:

After data are collected, data analysis is performed to assess that information and relate it to the defined issue. Alternative solutions are also clearly outlined. For example:

At this point, the pros and cons of each alternative are enumerated. See Table 8-2. Rec­ommendations are then made as to the best strategy for the firm. Of the available options, which is best? Table 8-2 also shows recommendations for the shoe-store issues discussed in this section.

Last, but not least, the recommended strategy is implemented. If research is to replace intu­ition in strategic retailing, a decision maker must follow the recommendations from research studies, even if those results seem to contradict his or her own ideas.

Let’s now look at secondary data and primary data in greater depth.

1. Secondary Data

ADVANTAGES AND DISADVANTAGES Secondary data have several advantages:

  • Data assembly is inexpensive. Company records, trade journals, and government publications are all rather low cost. No data collection forms, interviewers, and tabulations are needed.
  • Data can be gathered quickly. Company records, library sources, and Web sites can be accessed immediately. Many firms store reports in their retail information systems.
  • There may be several sources of secondary data—with many perspectives.
  • A secondary source may possess information that would otherwise be unavailable to the retailer. Government publications often have statistics no private firm could acquire.
  • When data are assembled by a source such as Progressive Grocer, Nielsen, Stores, or the government, results are usually quite credible.
  • The retailer may have only a rough idea of the topics to investigate. Secondary data can then help define issues more specifically. In addition, background information about a given issue can be gathered from secondary sources before undertaking a primary study.

Secondary data also have several potential disadvantages:

  • Available data may not suit the purposes of the current study because they have been collected for other reasons. Neighborhood statistics may not be found in secondary sources.
  • Secondary data may be incomplete. A service station owner would want car data broken down by year, model, and mileage driven, so as to stock parts. A motor vehicle bureau could provide data on the models but not the mileage driven.
  • Information may be dated. Statistics gathered every 2 to 5 years may not be valid today. The S. Census of Retail Trade is conducted every 5 years. Furthermore, there is often a time delay between the completion of a census and the release of information.
  • The accuracy of secondary data must be carefully reviewed. A retailer needs to decide if the data have been compiled in an unbiased way. The purpose of the research, the data col­lection tools, and the method of analysis should each be examined—if they are available for review.
  • Some secondary data sources are known for poor data collection methods; they should be avoided. When data conflict, the source with the best reputation for accuracy should be used.
  • In retailing, many secondary data projects are not retested and the user of secondary data has to hope results from one narrow study are applicable to his or her firm.

Whether secondary data resolve an issue or not, their low cost and availability require that primary data not be amassed until after studying secondary data. Only if secondary data are not actionable should primary data be collected. We now cite secondary data sources for retailers.

SOURCES There are many sources and types of secondary data. The major distinctions are between internal and external sources.

Internal secondary data are available within the company, sometimes from the data bank of a retail information system. Before searching for external secondary data or primary data, the retailer should look at information available inside the firm.

At the beginning of the year, most retailers forecast and develop budgets for the next 12 months. This helps outline planned spending for that year. A firm’s prior budget and its success in reaching budgetary goals are good sources of secondary data in forming a new budget.

Retailers use sales and profit-and-loss reports to judge performance. Many have data from electronic registers that can be studied by store, department, and item. By comparing data with prior periods, a firm gets a sense of growth or contraction. Overdependence on sales data may be misleading. Sales should be examined along with profit-and-loss data to indicate strengths and weaknesses in operations and management and to help lead to improvements.

Through customer billing reports, a retailer learns about inventory movement, sales by dif­ferent personnel, and sales volume. For credit customers, sales by location, repayment time, and types of purchases can be reviewed. Purchase invoices show the retailer’s own buying history and enables the retailer to evaluate itself against budgetary goals. See Figure 8-8.

Inventory records indicate the merchandise carried throughout the year and the turnover of these items. Knowing the lead time to place and receive orders from suppliers, as well as the extra inventory kept on hand to prevent running out at different times over the year, aids planning.

If a firm does primary research, the resultant report should be kept for future use (hopefully in the retail information system). When used initially, a report involves primary data. Later reference to it is secondary in nature since the report is no longer used for its primary purpose.

Written reports on performance are another source of internal secondary data. They may be prepared and filed by senior executives, buyers, sales personnel, or others. All phases of retail management can be improved through formal report procedures.

External secondary data are available from sources outside the firm. They should be con­sulted if internal information is insufficient for a decision to be made on a defined issue. These sources are comprised of government and nongovernment categories.

To use external secondary data well, appropriate online databases should be consulted. They contain all kinds of written materials, usually by subject or topic heading, for a specified time. Here are several databases, chosen for their retailing relevance. They are typically available through the Internet (for online access, you must use your company, college, or local library Web connection—direct entry to the sites is password-protected):

  • Academic Search Premier/EBSCOhost
  • Business Source Premier/EBSCOhost
  • Dow Jones Factiva
  • Gale’s Business & Company Resource Center
  • Gale Virtual Reference Library
  • Ingenta Connect
  • LexisNexis Academic Universe
  • Mergent Online
  • Plunkett Research Online
  • Standard & Poor’s NetAdvantage

The government distributes many materials. Here are publications chosen for their retailing value. They are available in a business library or other large library or through the Web:

  • Annual Retail Trade Survey
  • Consumer Expenditure Survey (Quarterly)
  • S. Census of Retail Trade (Every 5 years ending in 2 and 7)
  • S. Census of Service Industries (Every 5 years ending in 2 and 7)
  • Monthly Retail Trade and Food Services Sales
  • S. Survey of Current Business
  • Other (Registration data such as births, deaths, automobile registrations, etc. Available through federal, state, and local agencies.)

Government agencies, such as the Federal Trade Commission, provide online pamphlets on topics such as franchising, unit pricing, deceptive ads, and credit policies. The Small Business Administration provides smaller retailers with online literature and advice. Pamphlets are distrib­uted free or sold for a nominal fee.

Nongovernment secondary data come from many sources, often cited in reference guides. Major nongovernment sources are regular periodicals; books, monographs, and other nonregular publications; channel members; and commercial research houses.

Regular periodicals are available at most libraries or by personal subscription. A growing number are also available online; some Web sites provide free information, whereas others charge a fee. Periodicals may have a broad scope (such as Fortune) and discuss diverse business topics, or they may be narrower (such as Chain Store Age) and deal mostly with retail topics.

Many firms publish books, monographs, and other nonregular retailing materials. Some, such as Pearson Higher Education (www.pearsonhighered.com), have textbooks and practitioner books. The American Marketing Association (www.ama.org) offers information to enhance readers’ busi­ness knowledge. The Better Business Bureau (www.bbb.org) wants to improve the public’s image of business and expand industry self-regulation. The International Franchise Association (www .franchise.org) and the National Retail Federation (www.nrf.com) describe industry practices and trends, and they act as spokespersons to advocate the best interests of members. Other associations can be uncovered by consulting Gale’s Encyclopedia of Associations.

Retailers may also get information from channel partners such as ad agencies, franchise operators, manufacturers, and wholesalers. When those firms do research for their own purposes and offer some or all of the findings to their retailers, external secondary data are involved. Chan­nel partners pass on findings to enhance their own sales and retailer relations. They usually do not charge for the information.

The last external source is the commercial research house that conducts ongoing studies and makes results available to many clients for a fee. This source is secondary if the retailer is a subscriber and does not request tailored studies. Information Resources Inc., Nielsen, and Standard Rate & Data Service provide subscriptions at lower costs than a retailer would incur if data were collected only for its use.

Our blog (www.bermanevansretail.com) has posts on online sources of free external second­ary data—both government and nongovernment.

2. Primary Data

ADVANTAGES AND DISADVANTAGES After exhausting available secondary data, a defined issue may still be unresolved. In this instance, primary data (collected to resolve a specific topic at hand) are needed. When secondary data are sufficient, primary data are not collected. There are several advantages associated with primary data:

They are collected to fit the retailer’s specific purpose.

  • Information is current.
  • The units of measure and data categories are designed for the issue being studied.
  • The firm either collects data itself or hires an outside party. The source is known and con­trolled, and the methodology is constructed for the specific study.
  • There are no conflicting data from different sources.
  • When secondary data do not resolve an issue, primary data are the only alternative.

There are also several possible disadvantages often associated with primary data:

  • They are normally more expensive to obtain than secondary data.
  • Information gathering tends to be more time-consuming.
  • Some types of information cannot be acquired by an individual firm.
  • If only primary data are collected, the perspective may be limited.
  • Irrelevant information may be collected if the issue is not stated clearly enough.

In sum, a retailer has many criteria to weigh when evaluating the use of primary data. In par­ticular, specificity, currency, and reliability must be balanced against high costs, time, and limited access to materials. A variety of primary data sources for retailers are discussed next.

SOURCES The first decision is to determine who collects the data. A retailer can do this itself (internal) or hire a research firm (external). Internal collection is usually quicker and cheaper. External collection is usually more objective and formal. Second, a sampling method is specified. Instead of gathering data from all stores, all products, and all customers, a retailer may obtain accu­rate data by studying a sample of them. This saves time and money. With a probability (random) sample, every store, product, or customer has an equal or known chance of being chosen for study. In a nonprobability sample, stores, products, or customers are chosen by the researcher—based on judgment or convenience. A probability sample is more accurate but is also more costly and complex. Third, the retailer chooses among four methods of data collection: survey, observation, experiment, and simulation. All of the methods are capable of generating data for each element of a strategy.

SURVEY With a survey, information is systematically gathered from respondents by communicat­ing with them. Surveys are used in many retail settings. In a low-key, interactive manner, Sunglass Hut surveys its shoppers and encourages them to share their experiences through an interactive device known as Social Sun. Food Lion uses in-store surveys to learn how satisfied customers are and what their attitudes are on various subjects.

A survey may be conducted in person, over the phone, by mail, or online. Typically, a ques­tionnaire is used. A personal survey is face-to-face, flexible, and able to elicit lengthy responses; unclear questions can be explained. It may be costly, and interviewer bias is possible. A phone sur­vey is fast and rather inexpensive. Responses are often short, and nonresponse may be a problem. A mail survey can reach a wide range of respondents, has no interviewer bias, and is not costly. Slow returns, high nonresponse rates, and participation by incorrect respondents are potential problems. An online survey is interactive, can be adapted to individuals, and yields quick results. Yet, only certain customers shop online or answer online surveys. The technique chosen depends on the goals and requirements of the research project.

A survey may be nondisguised or disguised. In a nondisguised survey, the respondent is told the real purpose of the study. In a disguised survey, the respondent is not told the true purpose so that person does not answer what he or she thinks a firm wants to hear. Disguised surveys use word associations, sentence completions, and projective questions (such as, “Do your friends like shopping at this store?”). See Table 8-3.

The semantic differential—a listing of bipolar adjective scales—is a survey format that may be disguised or nondisguised. A respondent is asked to rate one or more retailers on several criteria, each evaluated by bipolar adjectives (such as unfriendly-friendly). By computing the average rating of all respondents for each criterion, an overall profile emerges. Figure 8-9 shows a semantic differential comparing two furniture retailers. Retailer A is a prestigious, high-quality store and retailer B is a mid-quality, family-run store. The semantic differential graphically por­trays their images.

OBSERVATION The form of research in which present behavior or the results of past behavior are noted and recorded is known as observation. Because people are not questioned, observation may not require respondent cooperation, and survey biases are minimized. Observation may be used in real situations. The key disadvantage of observation is that attitudes are not elicited.

Retailers use observation to determine the quality of sales presentations (by having research­ers pose as shoppers), to monitor related-item buying, to determine store activity by time and day, to make pedestrian and vehicular traffic counts (to measure the potential of new locations), and to determine the proportion of patrons using mass transit.

With mystery shoppers, retailers or their market research partners hire people to pose as customers and observe a service or a brand through visits, telephone calls, or Web site interactions. These mystery shoppers may evaluate operations, customer service experience, compliance with service standards, product availability, price, service calls, sales presentations, and how well store environments and displays are maintained. Some firms prefer video mystery shopping to address complex and challenging aspects of a service business.20

Observation may be disguised or nondisguised, structured or unstructured, direct or indirect, and human or mechanical. In disguised observation, the shopper or company employee is not aware he or she is being watched by a two-way mirror or hidden camera. In nondisguised obser­vation, the participant knows he or she is being observed—such as a department manager watch­ing a cashier’s behavior. Structured observation calls for the observer to note specific behavior. Unstructured observation requires the observer to note all of the activities of the person being studied. With direct observation, the observer watches people’s present behavior. With indirect observation, the observer examines evidence of past behavior, such as food products in consumer pantries. Human observation is carried out by people. It may be disguised, but the observer may enter biased notations and overlook behavior. Mechanical observation, such as a camera filming in-store shopping, eliminates viewer bias and does not miss behavior.

EXPERIMENT An experiment is a type of research in which one or more elements of a retail strategy mix are manipulated under controlled conditions. An element may be a price, a shelf display, store hours, or some other feature. If a retailer wants to find the effects of a price change on sales, only one item’s price is varied. Other strategic elements (location, quantity, etc.) stay the same, so the true price effect is measured.

An experiment may use survey or observation techniques to record data. In a survey, ques­tions are asked about the experiment: Did you buy Brand Z because of its new shelf display? Are you buying more ice cream because it’s on sale? In observation, behavior is watched during the experiment: Sales of Brand Z rise by 20 percent when a new display is used. Ice cream sales go up 25 percent during a special sale.

Surveys and observations are experimental if they occur under controlled situations. When surveys ask broad attitude questions or unstructured behavior is observed, experiments are not involved. Experimentation can be difficult because many uncontrollable factors (such as weather, competition, and the economy) come into play. A well-controlled experiment yields good data.

The major advantage is an experiment’s ability to show cause and effect (a lower price results in higher sales). It is also systematically structured and enacted. The major potential disadvantages are high costs, contrived settings, and uncontrollable factors.

SIMULATION A type of experiment whereby a computer program is used to manipulate the elements of a retail strategy mix rather than test them in a real setting is called simulation. Two kinds of simulation are now being applied in retail settings: those based on mathematical models and those involving “virtual reality.”

In the first kind of simulation, a model of the expected controllable and uncontrollable retail environment is constructed. Factors—such as effects of a price cut or longer store hours—are manipulated by computer (rather than the marketplace) so their effect on the overall strategy and specific elements of it are determined. No consumer cooperation is needed, and combinations of factors can be analyzed in a controlled, rapid, inexpensive, and risk-free manner. This format is gaining popularity as reliable software is increasingly available. However, it is still somewhat difficult to use.

In the second kind of simulation, a retailer devises or buys interactive software that lets participants simulate actual behavior in as realistic a format as possible. This approach creates a “virtual shopping environment.” For example, Facebook’s Oculus Rift VR headset now makes it possible to render virtual shopping environments at lower costs; and the glasses can be enhanced with eye-tracking capability to make it an efficient shopper research tool. SMI studies on the virtual shopper journey using EEGs (which test the electrical activity of the brain) have had par­ticipants use eye-tracking and real-time consumer behavior in a virtual setting to assess the impact of in-store campaigns on buying decisions and how consumers interact with merchandise displays and package design before deciding to buy. Participants virtually interact with signs and prod­ucts displayed in the VR headset as a natural experience; findings can be used to devise real-life store campaigns. The simulated space can easily compare several conditions (A/B testing) of in-store campaigns and shelf placements.21

Source: Barry Berman, Joel R Evans, Patrali Chatterjee (2017), Retail Management: A Strategic Approach, Pearson; 13th edition.

Eating Patterns in America

Household changes will shape the future of eating for years to come. The “typical” U.S. consumer and the households in which they live are very different from those of 20 years ago. The changes are reflected across the spectrum of eating patterns today—who, what, when, where, how, and why.

Single-person U.S. households are 38 million strong and growing—the highest in history—This represents 55 percent of all adult only households. The typical size of an American family is 2.5 persons per household, with more than one-quarter with children headed by single moms. Smaller households, in many cases, are a long-term choice for adults choosing not to be married and/or have fewer children. This change has wide- ranging implications for retailers and manufacturers in terms of marketing, merchandising, new product development, packag­ing, and positioning.

By 2044, the U.S. Census Bureau projects that more than one-half of Americans will be in a minority group; by 2060, nearly one in five of the total population is projected to be foreign-born. The Hispanic population has accounted for more than half of the 27-million U.S. population increase in the last decade. Hispanics currently represent 18 percent of the total U.S. population. Although Hispanics will continue to be a very large and growing group, Asians are one of the fastest-growing ethnic populations, currently representing 8 percent of the U.S. population.

The Millennial generation is more diverse than the preced­ing generations, with 44 percent being part of a minority race or ethnic group. Even more diverse than Millennials are the youngest Americans—those younger than 5 years of age. In 2014, this group became majority-minority for the first time, with 50 percent being part of a minority race or ethnic group.

The share of the U.S. population that is considered middle income has been shrinking over the last four decades. In the past, those in the middle-income group typically moved up into higher income levels; today, however, the opposite is true. Declining or stagnant wages, coupled with a growing income gap during the past 15 years, have resulted in many families slipping out of the middle class.

If past trends continue, it’s unlikely that recovery from the Great Recession will lead to a rebound in the share of adults in middle-income households. Since the middle class has fueled spending on everything from housing to cars to food purchas­ing, a smaller middle class has a wide-ranging impact on the economy. See Figure 1.

This overview presents just a few of the changing con­sumer dynamics that will shape the retail marketplace in the future—both near and long term. Retailers need to be aware of changes in consumer behaviors in order to modify their market­ing tactics and strategies, and to meet the needs and wants of today’s consumers.

Source: Barry Berman, Joel R Evans, Patrali Chatterjee (2017), Retail Management: A Strategic Approach, Pearson; 13th edition.

The Convenience Economy Comes of Age

Among the transformations on the retail landscape in the recent past, perhaps none was more profound than proliferation of the “convenience economy,” in which everything is at the consum­er’s disposal at the click of a button, according to Chris Bryson, CEO of Unata, a leading omnicommerce solutions provider. He states, “2015 was the year UberX went from a smaller, unknown player to a force driving change across sectors. We’re at a point where new business ideas are often described as ‘Uber for_______ .”’

The convenience economy’s biggest shift, Bryson says, “came when major players like Starbucks started embracing it with the “Order Ahead mobile app,” which has led to “wide­spread adoption of this kind of immediate customer transaction, and reinforced the need for quick and convenient service on a daily basis,” and with it, a huge shift in consumer expectations across all sectors.

Retailers of all stripes “are suddenly playing catchup, learning how they can incorporate real-time, on-demand trans­actions into their strategies,” notes Bryson, who founded Unata in 2011. The company’s roster of grocery clients includes Longo’s, Grocery Gateway, Lowes Foods, Lunds and Byerlys, and Raley’s. When asked to elaborate on some examples of the convenience economy now catching his eye, and which are the most important, Bryson ticks off a shortlist of standouts, includ­ing the following.

  • UberX/UberEATS: “Consumers don’t have to call to order their car/food, take out their wallets to pay, or wait very long for their car/food to arrive. They can watch the driver travel and arrive live on a map, with the ability to commu­nicate with their driver at the click of a button.”
  • Starbucks: “The Order Ahead app is simple and easy to use, and saves the customer minutes on a daily basis— which becomes especially valuable on rushed mornings. They are reinforcing this type of customer experience on a daily basis.”
  • Ritual: “This is a Toronto-based app—expanding in the United States—that lets consumers order lunch ahead of time from various restaurants near their location. The app notifies consumers exactly when they should leave their current locale so they arrive at the restaurant just when food is ready for pickup, ensuring the food remains as hot and fresh as possible. Ritual is a simple and clean user experience that lets customers order food in a couple of clicks and saves them 5 to 10 minutes a day of waiting time.”
  • Amazon Echo and Dash with Prime: “With both Amazon Echo and Dash, consumers don’t have to write a shopping list, go to their computers, or even pull out their phones to make an order, or take out their wallets to pay. With Dash buttons, they can order at the click of one button; and with Echo, Amazon has taken the click out entirely. It’s the easi­est possible way for consumers to online shop. Combined with Amazon Prime, consumers don’t have to wait long to get things that they’ve ordered.”

Although it’s still unclear what the shopper of the future will find the most convenient way to shop for groceries, Bryson says, “The convenience economy so far tells us that the fewer clicks needed, the more adoption there will be, which is why we have our eye on Amazon Echo. We’ve seen how quickly Uber has changed the landscape, and we expect it to continue to change just as quickly in ways we don’t yet know over the next few years. Retailers need to focus on setting up their sys­tems so they can easily flex, adapt, iterate, and connect with new systems.”

Source: Barry Berman, Joel R Evans, Patrali Chatterjee (2017), Retail Management: A Strategic Approach, Pearson; 13th edition.

Are Hot Retailers of 2015 Still Hot?

Differentiation is important for the nation’s fastest-growing (“hot”) retailers. These retailers typically come in a variety of different flavors, but one thing they have in common is that they all do things a little differently—and this helps them get (and often) stay ahead of the pack.

Chart-topper Hudson’s Bay is “hot” because at least one man in retailing thinks there is still a place for the traditional department store. Hudson’s Bay Executive Chairman Richard Baker, who bought Lord & Taylor 9 years ago, has assembled a conglomerate operating in three countries on two continents.

Runner-up NoMoreRack.com, founded in November 2010 and offering deep discounts on an array of general merchandise, was rebranded as Choxi in 2015 after Nordstrom objected to its name (due to possible confusion with its Nordstrom Rack off-price division). The new name is a mixture of “chock full” and “choice.” It is not a real word in any language — which can assist a firm expanding globally.

Number 3, Zulily, has elevated the flash sale model to new heights. The company’s early strength was in infant clothing, toys, and accessories with a very strict no-returns policy. In May 2015, Zulily began a test program that allows some customers to return some brands of apparel and home linens.

“The Hot 100 is a mix of companies that have balance sheets that allow them to make acquisitions or grow organi­cally,” explains Bryan Gildenberg, the chief knowledge officer at Kantar Retail, providers of the Hot 100 data. “Hot 100 retail­ers can grow more quickly because they understand why people are buying. They understand the dynamics of their audience.” Among those following the acquisition trail is Number 4, G-III Apparel Group. Best known as a soft-goods vendor to major department and specialty stores, it also operates its own retail stores under the Wilsons Leather, Bass, G. H. Bass & Co., Vilebrequin, and Calvin Klein Performance banners.

Ranking as Number 5 is Wayfair, the umbrella company for five different home furnishings and decor E-commerce brands. The firm had a particularly good holiday selling season 2 years ago, with the active customers in its direct retail busi­ness reaching 3.2 million at year-end, up 54 percent from a year earlier.

Two years ago, Number 7 on the list, Office Depot pur­chased a major rival in OfficeMax and not too long afterward put itself in position to be taken over by Staples, potentially reducing the number of office supply superstore operators to just one. If the Staples takeover cleared regulatory hurdled, Wall Street analysts said they expected at least 1,000 office supply stores to be closed around the country. (Authors’note: Due to U.S. government objections, the two companies called off their merger in early 2016. For both firms, their physical stores are vulnerable to online retailers such as Amazon.com.)

Both Number 8, Signet Jewelers, and Number 9, Men’s Wearhouse, acquired major rivals in Zale and JoS. A. Bank, respectively. Signet has put together the only national group of mall-based popular-priced jewelry stores, and Men’s Wear- house has achieved pretty much the same among men’s apparel retailers after turning the tables on JoS. A. Bank, which had tried to take over Men’s Wearhouse.

Together, supermarkets and apparel stores account for nearly half of the Hot 100 entries. Most of the Hot 100 super­markets have “core categories that are growing very quickly,” Gildenberg says, such as an emphasis on natural and organic foods or a store full of ethnic products.

Source: Barry Berman, Joel R Evans, Patrali Chatterjee (2017), Retail Management: A Strategic Approach, Pearson; 13th edition.

Navigating the Shopper Universe through Big Data

Taking on the challenge of understanding the motivations behind why shoppers buy what they buy, and how they buy it, could pay off in manifold ways. “There are lifestyle tensions that impact shopping behavior for each shopper segment, but these tensions often extend beyond the store: time stress, finan­cial pressure, and information overload,” explains John Esse- gian, executive vice-president at TNS Global. “Retailers can increase their market share with each segment by understanding and addressing these important lifestyle tensions.”

TNS Shopper Universe is a large syndicated database that maps competition for Grocery, Mass/Supercenter, Club, Convenience, Dollar Store, Drug, Natural/Organic, Pet, and Home Improvement retailers. It shows how shoppers perceive the marketplace, shopper segmentation for targeting, and occa­sion-based need segmentation detailing what’s most motivat­ing to shoppers on each trip. The database provides retailers and manufacturers with a comprehensive understanding of this broad marketplace, and the key drivers of choice for shoppers.

“Shoppers’ functional needs are generally well met,” Essegian says. “Yet, opportunities exist to engage shoppers more emotionally, such as helping them simplify their lives, leveraging modern technology, and creating a more experien­tial shopping trip.” TNS identifies nine occasion-based need states. Just over half of shopping trips, defined by consumer needs, are more experience-driven, whereas the rest tend to be task-focused.

1. Experience-Driven Needs

The experience-focused need states break down as follows: (1) Smart Fami1y Fun: These consumers want shopping to be fun, relaxing, and productive (so they can take care of family needs). They expect enjoyment to be facilitated by technology aids, a convenient and pleasant in-store experience, and good value.

Only the Best: Needs on these shopping trips are for top-tier brands, often outside the mainstream, including fresh, healthy, and natural products. (3) Rewarding Experience: This shop­ping is uplifting and inspiring, thanks to the combination of the retailer’s values, great staff, and interesting and unique prod­ucts. (4) Food Safari: Shoppers want this kind of trip to be more than just stocking up on staples; they want a little adventure and exploration. It’s a chance to try new and different products such as exotic, gourmet, organic, and healthy items.

2. Task-Driven Needs

Task-focused need states shake out as follows: (1) Weekly Gro­cery Shopping: These shoppers want every item their family needs for the week under one roof. The store needs to have a wide selection of packaged and fresh food items. This shopper looks to coupons and quality store brands to help stay on bud­get. (2) Hassle-Free Value: The shopping trip should be easy and efficient, providing good deals and incentives while cov­ering all brand needs, from premium to quality store brands. (3) Personal Care Plus: These shoppers are looking for a store with a good selection of personal care and household items that they can shop at any time of the day or night. They also want a good selection of snacks and beverages. (4) All-Around Value: These shoppers want a place for stocking up and bargain hunt­ing, with everyday low prices, great specials, and economical package sizes. Hours should be convenient, and it should be a place that kids enjoy. (5) Grab and Go: This is about fulfilling an immediate need to quickly and easily grab a snack, beverage, or fill-in item at a store located on the shopper’s normal route.

Most generalists, such as grocery, mass, and club retailers, have an incentive to align to both task-driven and experiential need states. Specialty stores tend to be more associated with experiential shopping. While each segment participates, to at least some degree, more engaged shoppers tend to have more experiential needs.

Source: Barry Berman, Joel R Evans, Patrali Chatterjee (2017), Retail Management: A Strategic Approach, Pearson; 13th edition.

How Do You Attract and Satisfy Millennials?

1. Introduction

How do you connect with a generation that defies easy categorization?

The members of Generation Y (Millennials) have per­plexed many knowledgeable retailers for more than a decade. There is a stereotype that all Millennials are broke 20-some­things who live with their parents, but that’s only a small seg­ment of the cohort. Many Millennials are homeowners, married with children, and more concerned about their investments and saving for college than playing videogames.

If there’s one thing all Millennials have in common, it’s an immersion in the digital world. If they weren’t fully born in the digital age, they spent formative years and entered early adult­hood in a rapidly changing environment of phones, computers, and devices that connect them to each other and the world.

2. Large and Diverse

Generation Y will drive the future of retail, and experts say retailers’ success will hinge on how they understand and give this cohort the experience it desires. Millennials, roughly defined as those born between the early 1980s and the late 1990s, have surpassed Baby Boomers as the largest gen­eration. The Pew Research Center estimates that there are roughly 75 million Americans between the ages of 18 and 34, and they represent a wide array of characteristics and preferences.

Although a younger segment may meet the “broke and living at home” stereotype, it doesn’t characterize the genera­tion as a whole, says researcher Jason Dorsey; all discussions around Millennials have to start with knowing their diversity: “A [Millennial] could be married in a two-income household with two kids or living at home with mom or three roommates. You can’t speak to them in the same way!”

A 2015 report by Oracle (the software firm) breaks Mil- lennials into five different groups:

  • “Up and Comers” represent a diverse group of males with high incomes but low awareness levels.
  • “Mavens” are 30-something high earners with a child.
  • “Eclectics” are female free spirits on the lookout for the perfect deal and a high level of Amazon awareness.
  • “Skeptics” tend to be gamers focused on social media, sci- fi films, and fast food.
  • “Trendsetters,” the youngest segment of the generation, keep up with the latest and greatest and purchases across a wide variety of brands.

Millennials are also the most racially diverse generation, with 43 percent identified as non-Caucasian. Multiculturalism and a high acceptance of interracial marriage are blurring the lines between cultural and racial demographics.

Ryan McConnell, senior vice-president and head of North American subscription services for the Futures Company, calls the cohort “the Big Blend.” He says categorization along the lines of

things like race, gender, and sexual orientation is disappearing. “If you’re big on categorization, you’re forcing people into boxes,” he says, “and that doesn’t bode well among Millennials.”

Conflicting data and the complexity of the generation has spawned myths about who the Millennials are. A 2013 Accen­ture report found that the biggest misconceptions related to Mil- lennials’ preferences in retail were that they only shop online, have no loyalty, and treat retailers the same as people on social networks. Retailers are discovering, however, that they can be the complete opposite.

3. Unified by Digital

Many Millennials have spent their adulthood ordering goods and services, paying their bills, and banking online. They inter­act with the world through social media; and when it comes to retail, they have no tolerance for companies that lag behind in technology.

A survey by research firm BI Intelligence found that 40 percent of Millennials would give up cash completely if they could rely on plastic or mobile payments. More than 90 percent of those aged 18 to 34 have used a self-service kiosk, according to a 2015 study by location-based mobile platform company Retale, versus 81 percent of those 35 and older; 72 percent of respondents choose self-checkout because they have a limited number of items, while 55 percent do so because there is no line. Authors’Note: These numbers do not total to 100 percent due to multiple responses.

Interestingly, 20 percent of Millennials (8 percent more than other generations) said they choose self-service to avoid interacting with cashiers, and yet, the Accenture study found that 82 percent of Millennials prefer visiting bricks-and-mortar stores.

The 18-to 34-year-olds certainly interact through social media. A recent Deloitte (financial consulting) survey found that 47 percent use social media while shopping, compared with only 19 percent for all other age groups. Another survey by Web analytics company SDL revealed Millennials check their smartphones an average of 43 times daily, and five out of six connect with companies via social media.

Waiting isn’t an option. Same-day delivery would make 64 percent of Millennials more likely to make a purchase online, according to a survey by Coldwell Banker Commercial Affili­ates, compared with 56 percent of Gen Xers and 40 percent of Baby Boomers.

“Time and quality of life can be more important than money for Millennials,” says Willy Kruh, global chairman of consumer markets at KPMG. “If you don’t grab them in three seconds, and if you can’t [provide] next-day delivery, they’re gone.”

Millennials are constantly bombarded with so much infor­mation over so many devices and media that “you have to get them with bite-sized information,” he says. “You also have to design your Web site in that fashion. They want everything, including the [purchase process], to be short and fast.”

4. Conscientious Consumers

Young people in every generation show an elevated sense of idealism, but Millennials have a tendency to put their money where their mouth is. Concepts such as social responsibility, sustainability, gender equality, and fair trade are more than just buzzwords.

A 2015 Nielsen survey revealed three in four Millenni­al would be willing to pay extra for “sustainable offerings.” They’re more likely than other generations to wonder where their products come from, how they’re made, and how retailers view social issues.

Exclusivity and equality are non-negotiable. Generation Y is overwhelmingly progressive, socially liberal, and in favor of gay marriage and women’s reproductive rights. “If you are put­ting out a message that you are not open for everyone, if you’re not accepting of different cultures, different lifestyles, and dif­ferent ways of being, then there’s going to be a real problem” for retailers, says Ryan McConnell.

A brand survey by digital ad agency Moosylvania revealed that the top five Millennial brands in 2015 were Nike, Apple, Samsung, Sony, and Walmart. Of respondents to that survey, 40 percent said social responsibility played into their criteria, whereas 39 percent said the company “shared similar interests.”

A Pew survey on demographics also found Millennials are less anchored to traditional institutions. Nearly 30 percent claim to have no religious affiliation, compared with 21 percent of Gen Xers and 16 percent of Baby Boomers. On the issue of politics, 50 percent consider themselves to be independent, compared with 39 percent of Gen Xers and 37 percent of Baby Boomers.

Millennials place more emphasis on happiness and experi­ence than on possessions. The generation is leading the “sharing economy” through things such as peer-to-peer lending, crowd­funding, and companies that rent products or offer short-term use. They’re more likely to use services such as Airbnb and Uber and sites like Neighborgoods, where consumers can rent or borrow products from one another.

Although a PricewaterhouseCoopers study found that only 44 percent of consumers overall are familiar with the sharing economy and just 19 percent have engaged in such a trans­action, those most excited about the sharing economy once they’ve tried it are those aged 18 to 24, households with income between $50,000 and $75,000, and those with kids in the house under age 18.

Many Millennials have shifted to a more simplistic life­style; 78 percent of respondents in the PricewaterhouseCoo- pers report said sharing reduces clutter and waste. “Millennials aren’t as into accumulating things,” Willy Kruh states. “They don’t see things such as a car as status symbols. They’re much happier to lease it or rent it, and that preference is having huge reverberations in many industries, including retail.”

PricewaterhouseCoopers reports that “today’s consumers are finding more satisfaction and status in experiences, rather than static material possessions.” McConnell says Millennials tend to worry less about being flashy and more about being “authentic.” “They have more value for a minimalist lifestyle than [Boomers and Gen Xers]. They realize there’s a burden that comes with ownership,” he says.

Because Millennials spend more than any other group on leisure activities while seemingly struggling in other aspects of life, they’re perceived as bad with money. The reality is they’re more apt to pay with available funds than use credit cards, according to a study by software firm Segmint. Rob Heiser, CEO of Segmint, says Millennials are actually very conscious about how they spend their money. “Deeper insights into data reveal that many Millennials make spending decisions after much research and consideration, rather than impulse.”

4. Higher Expectations

Christopher Donnelly, senior managing director for retail at Accenture, says Millennials are “fundamentally not much dif­ferent than anyone else, except they like doing things digitally.” That digital preference has raised the bar for the customer expe­rience.

Much of the generation has always been able to find out anything about any product and order from any merchant in the world. A study by SDL revealed that nearly 60 percent of Mil- lennials surveyed expect to engage with a company whenever they choose, by any channel they desire.

Sarah Clark, vice-president of product at Mitek Systems, says Millennials are leading the adoption of mobile payment in retailing. Mitek’s survey with Zogby Analytics found that 86 percent of Millennials have used their smartphone to make a purchase, with 40 percent having spent $100 or less. Nearly one-half of the respondents have made the decision on where to shop based on a mobile app’s features and functionality. They’d also like to make things even easier, with 68 percent saying they’d prefer to always use their smartphone camera for a mobile capture instead of manually typing information.

“It’s a wake-up call to retailers to continue to focus on the mobile experience,” Clark says. “Making things easier is extremely important,” as is adopting new technologies as soon as they appear. Retailers that wait for months or years to engage in the new ways may be seen as too out of touch. Millennials “adapt [to technology] very quickly and they expect that retail­ers will do the same,” she says.

5. Loyalty: Embracing Change

Millennials have grown up in a world where loyalty is seem­ingly going by the wayside. Lifelong careers are gone; Alex­andra Levit, co-author of a Harris Interactive study about the future of Millennials’ careers, said the average Millennial may work up to 15 jobs in his or her lifetime.

Futures Company’s Ryan McConnell believes that very few Millennials are willing to stick with a retailer simply for the sake of legacy (past purchase behavior); they need to be moti­vated by service, brand affiliation, a “message,” or price. “Their loyalty can vary by industry,” he says. “You might find loyalty for companies such as Apple, but they’ll quickly go somewhere else and follow their friends.”

Willy Kruh of KPMG says Millennials may be the “least loyal generation” unless a company shows it’s “listening to them” and engage in “evolution.” Then, they can become “very loyal.”

A November 2015 survey by global strategic branding and design firm Landor Associates found that Millennials seek long-term relationships with brands that embrace change in ways they feel are authentic, foster trust, and are respectful of heritage and values. The survey revealed that Millennials expect brands to be “agile and navigate a tension between change and continuity.” Landor CEO Lois Jacobs comments, “As digital natives, Millennials are used to the rapid speed of the market and they expect brands to be as well.” She adds, “They have shifted the marketing landscape. We no longer live in an era of mass marketing.”

According to Ryan McConnell, Millennials have a strong sense of individualism, which is a big shift from previous gen­erations when they were in their late teens and twenties. There’s less of a need to be or look exactly like their friends. “Today, what’s really hip or cool is being different. There aren’t any [unifying] styles,” he says. “There’s an incredible inclusiveness about this generation that accepts different lifestyles and ways of expressing yourself.”

Most Millennials are more trusting of their friends and social media networks than traditional advertising, says Kruh. Nearly 90 percent of respondents in McCarthy Group’s Engag­ing Millennials Study did not like traditional ads, and that lack of trust extended to both people and institutions. The Pew demographics survey found that when they were asked if people can generally be trusted, only 19 percent of Millennials said yes, compared with 31 percent of the Gen Xers and 40 percent of the Baby Boomers.

And even though 8 in 10 Millennials say they’re generally optimistic about their future, 51 percent of them believe they will get no benefits from Social Security, whereas 39 percent predict they will get benefits at reduced levels.

6. They’re Not All Broke

Every generation likes to think it had it tougher than those who come later. However, Millennials do have a huge mountain to climb on almost every economic front. They have lower levels of wealth and personal income than Gen Xers and Baby Boom­ers did at the same stage in their lives; and they are spending far more on things like their rent and food than previous genera­tions did.

Young households are also carrying far higher levels of stu­dent loan debt. “These things can be a massive drag on spend­ing,” says researcher Dorsey.” It changes the options they have.”

Millennials are what previous generations might call “late bloomers.” They are more likely to live at home longer, and they wait longer to get married, longer to have kids, and longer to buy a house. According to a report from Goldman Sachs, nearly 30 percent of them live at home with their parents. Furthermore, only 23 percent of Millennials were married and living in their own households in 2012, as compared with 43 percent of that age group in 1981 and 56 percent in 1968.

That doesn’t mean they don’t have money to spend, how­ever. On an individual basis, they may spend less on certain things than previous generations, but their sheer numbers can make up for it in total volume. Kruh says Millennials think with a “differ­ent cost-benefit analysis.” Experience is essential, and not always about whether they can afford it or not. Millennials living at home also have a big impact on how their parents shop, by exposing them to new technologies and their values around sustainability.

The biggest factors are their core buying power and the fact that there will be a “tremendous wealth transfer” in the future from Baby Boomers to Millennials. According to Accen­ture, Generation Y is in line to inherit more than $30 trillion from Baby Boomers over the next few decades. As a result, researcher Dorsey says because of their current ages, life expec­tancy, and purchasing patterns, Millennials actually represent “the greatest lifetime value of any customer segment you can win in retail.” See Figure 1.

Source: Barry Berman, Joel R Evans, Patrali Chatterjee (2017), Retail Management: A Strategic Approach, Pearson; 13th edition.

The Importance of Location to a Retailer

Location decisions are complex. Costs can be quite high, there is little flexibility once a site is chosen, and locational attributes have a big impact on a strategy. One of the oldest retailing adages is that “location, location, location” is the major factor leading to a firm’s success or failure. See Figure 9-1.

A good location may be substantial enough to allow a retailer to succeed even if its strategy mix is mediocre. A hospital gift shop may do well, although its assortment is limited, its prices are high, and it does not advertise. On the other hand, a poor location may be such a liability that even superior retailers cannot overcome it. A mom-and-pop store may do poorly if it is across the street from a category-killer store; although the small firm features personal service, it cannot match the selection and prices. At a different site, however, it might prosper.

The choice of a location requires extensive decision making due to the number of criteria considered, including population size and traits, the competition, transportation access, parking availability, the nature of nearby stores, property costs, the length of the agreement, legal restric­tions, and other factors.

A store location typically necessitates a sizable investment and a long-term commitment. Even a retailer that minimizes its investment by leasing (rather than owning a building and land) can incur large costs. Besides lease payments, the firm must spend money on lighting, fixtures, a storefront, and so on.

Although leases of less than 5 years are common in less desirable retailing locations, leases in good shopping centers or shopping districts are often 5 to 10 years or more. It is not uncommon for a supermarket lease to be 15 or 20 years. Department stores and large specialty stores on major downtown thoroughfares occasionally sign leases longer than 20 years.

Due to its fixed nature, the investment, and the length of the lease, store location is the least flexible element of a retail strategy. A firm cannot easily move to another site or convert to another format. Also, a retailer may be barred from subleasing to another party during the lease period; if a company breaks a lease, it may be responsible to the property owner for financial losses. In contrast, ads, prices, customer services, and assortment can be modified as the environment (con­sumers, competition, the economy) changes.

Even a retailer that owns its building and land may also find it hard to change locations. It has to find an acceptable buyer, which might take several months or longer, and it may have to assist the buyer with financing. It might also incur a loss, should it sell during an economic downturn.

A firm moving from to another locale faces three potential problems. (1) Some loyal shop­pers and employees may be lost; the greater the distance between the old and new sites, the big­ger the loss. (2) A new site may not have the same traits as the prior one. (3) Most store fixtures and renovations at a site cannot be transferred; their value is lost if they have not been fully depreciated.

Store location affects long- and short-run planning. In the long run, the choice of location influences the overall strategy. A retailer must be at a site that is consistent with its mission, goals, and target market for an extended time. It also must regularly study and monitor the status of the location as to population trends, the distances people travel to the store, and competitors’ entry and exit—and adapt accordingly.

In the short run, a location has an impact on specific elements of a strategy mix. A retailer in a downtown area with many office buildings may have little pedestrian traffic on weekends. It may be futile to try to sell items such as major appliances there. (Such items are often bought jointly by adult household members.) The retailer could either close on weekends and not stock certain products or remain open and try to attract customers to the area by aggressive promotion or pricing. If the retailer closes on weekends, it adapts its strategy mix to the attributes of the location. If it stays open, it invests additional resources in an attempt to alter shopping habits. A retailer that strives to overcome its location, by and large, faces greater risks than one that adapts.

Retailers should follow these four steps in choosing a store location:

  1. Evaluate alternate geographic (trading) areas in terms of the characteristics of residents and existing retailers.
  1. Determine whether to locate as an isolated store in an unplanned business district or in a planned shopping center within the geographic area.
  1. Select the general isolated store, unplanned business district, or planned shopping center location.
  1. Analyze alternate sites contained in the specified retail location type.

The selection of a store location is a process involving each of these steps. This chapter focuses on Step 1; Chapter 10 examines Steps 2, 3, and 4.

Source: Barry Berman, Joel R Evans, Patrali Chatterjee (2017), Retail Management: A Strategic Approach, Pearson; 13th edition.

Retail Trading-Area Analysis

The first step in choosing a retail store location is to describe and assess alternate trading areas and then choose the best one. A trading area is a geographical area containing the customers and potential customers of a particular retailer or group of retailers for specific goods and/or services. The size of a trading area typically reflects the boundaries within which it is profitable to sell and/ or deliver products.2 After a trading area is selected, it should be reviewed regularly.

A thorough analysis of trading areas provides several benefits:

  • Consumer demographic and socioeconomic characteristics are examined. For a new store, the study of proposed trading areas reveals opportunities and the retail strategy needed to succeed. For an existing store, it can be determined if the current strategy still matches consumer needs. The focus of promotional activities is ascertained, and the retailer can look at media coverage patterns of proposed or existing locations. If 95 percent of customers live within 3 miles of a store, it would be inefficient to advertise in a paper with a citywide audience.
  • A chain retailer learns whether the location of a proposed new store will reach additional customers or take business from existing stores. Suppose a supermarket chain has a store in Jackson, Mississippi, with a trading area of 2 miles, and it considers adding a new store, three miles from the Jackson branch. Figure 9-2 shows the distinct trading areas and expected store overlap. The shaded portion represents the trading-area overlap, where the same custom­ers are served by both branches. The chain must look at the overall net increase in sales if it adds the proposed store (total revised sales of existing store + total sales of new store — total previous sales of existing store).
  • Chains anticipate whether competitors want to open nearby stores if the firm does not do so itself. That is why TJX has two of its chains, T. J. Maxx and Marshalls, situate within 1.5 miles of each other in more than 100 U.S. markets, even though they are both off-price apparel firms.
  • The best number of stores for a chain to operate in a given area is calculated. How many out­lets should a retailer have in a region to provide good service for customers (without raising costs too much or having too much overlap)? When CVS pharmacy entered Atlanta, it opened nine new drugstores in one day. This gave it enough coverage of the city to service residents, without placing stores too close together. A major competitive advantage for Canadian Tire Corporation is that four-fifths of the Canadian population lives within a 15-minute drive of a Canadian Tire store.
  • Geographic weaknesses are highlighted. Suppose a suburban shopping center does an analysis and finds that most of those residing south of town do not shop there, and a more comprehen­sive study reveals that people are afraid to drive past a dangerous railroad crossing. Due to its research, the shopping center could exert political pressure to make the crossing safer.
  • The impact of the Internet is taken into account. Store-based retailers must examine trading areas more carefully than ever to see how their customers’ shopping behavior is changing due to the Web.
  • Other factors are reviewed. The competition, financial institutions, transportation, labor avail­ability, supplier location, legal restrictions, and so on can each be learned for the trading area(s) examined.

1. The Use of Geographic Information Systems in Trading-Area Delineation and Analysis

Increasingly, retailers are using geographic information system (GIS) software, which combines digitized mapping with key locational data to graphically depict trading-area characteristics such as population demographics; data on customer purchases; and listings of current, proposed, and competitor locations. Commercial GIS software lets firms quickly research the attractiveness of different locations and access computer-generated maps. Before, retailers often placed different color pins on paper maps to show current and proposed locales—and competitors’ sites—and had to collect and analyze data.3

Most GIS software programs are extrapolated from the decennial Census of Population and the U.S. Census Bureau’s national digital map (known as TIGER—topologically integrated geo­graphic encoding and referencing).4 TIGER incorporates all streets and highways in the United States. TIGER files may be accessed online free using its web-based platform TIGERweb or as Shapefiles downloads. TIGERweb’s Web Map Service (WMS) maps may be adapted to reflect census tracts, railroads, highways, waterways, and other physical attributes of any U.S. area, but they do not show retailers or other commercial entities. Many versions of the TIGER data are available for download and adaptation based on level of detail.5 See Figure 9-3 shows the breadth of TIGER services.

Mapping software from private firms have many more enhancements than TIGER does. These firms often offer free demonstrations, but they expect to be paid for their software. Although GIS applications differ by vendor, they generally can be accessed or bought for as little as $100 (or less) or for as much as several thousand dollars. They are designed to work with personal computers, and allow for some manipulation of trading-area data.

Private firms that offer mapping software include:

  • Alteryx (http://analytics.alteryx.com/spatial-analytics)
  • Autodesk (http://usa.autodesk.com)
  • Caliper Corporation (caliper.com)
  • Esri (esri.com)
  • geoVue (geovue.com)
  • Kalibrate (kalibrate.com/market-intel-cloud)
  • Nielsen’s Claritas Location Mapping (http://goo.gl/iiNj8T)
  • Pitney Bowes Location Intelligence (www.pitneybowes.com/us/location-intelligence.html)
  • Tele Mart GIS Mapping (www.tele-mart.com/gis-mapping.php)
  • Tetrad (www.tetrad.com)

Many of these companies have free demonstrations at their Web sites.

Geographic information system software can be applied in various ways. A chain retailer could learn which of its stores have trading areas with households having a median annual income of more than $50,000. That firm could derive the sales potential of proposed new store locations and their potential effect on sales at existing stores. It could also use software to learn the demo­graphics of customers at its best locations and set up a computer model to find potential locations with the most desired attributes. A retailer could even use the software to pinpoint its geographic areas of strength and weakness.

These three examples show how retailers benefit from GIS software:

  • Starbucks uses GIS software from Esri to create and use store location data, maps, and models through employee desktops, in browsers, or on mobile devices. A new capability of this soft­ware is its ability to generate “heat maps” that depict the distribution of Starbucks locations. The points on the GIS maps can be grouped on a small scale to analyze regional patterns and on a large scale to view patterns within a metropolitan area. The heat maps depict the density of Starbucks locations. The Esri-based software provides Starbucks with data on population demographics, population density, auto traffic patterns, public transportation, and the types of nearby stores. Starbucks uses the data in making decisions about new store openings as well as menu options tailored to the store.6
  • Walgreens has used GIS technology since 2000. Its new system, called WalMap, contains interactive maps that can be used to determine the best place to locate a new store on the basis of demographic trends, competitor locations, and sales trend data. This software, which can be viewed on an iPad, contains location-specific data so store managers and Walgreens’ corporate-level real-estate team can use the information. With the use of mobile devices, managers no longer have to print out maps to access important information.7
  • GFK GeoMarketing offers GIS software services that assist international retailers that want to expand overseas. The software helps find best locations for store networks, identifying regional target groups, and determining product demand. RegioGraph helps retailers analyze and visualize their data on digital maps.8

2. The Size and Shape of Trading Areas

Each trading area has three parts: The primary trading area encompasses 50 to 80 percent of a store’s customers. It is the area closest to the store and possesses the highest density of customers to population and the highest per capita sales. There is little overlap with other trading areas. The secondary trading area contains an additional 15 to 25 percent of a store’s customers. It is located outside the primary area, and customers are more widely dispersed. The fringe trading area includes all the remaining customers, and they are the most widely dispersed. A store could have a primary trading area of 4 miles, a secondary trading area of 5 miles, and a fringe trading area of 10 miles. The fringe trading area typically includes some outshoppers who travel greater distances to patronize certain stores.

Figure 9-4 shows the makeup of trading areas and their segments. In reality, trading areas do not usually follow such circular patterns. They adjust to the physical environment. The size and shape are affected by store type, store size, location of competitors, housing patterns, travel time and traffic barriers (such as toll bridges), and media access. These factors are discussed next.

Two stores can have different trading areas even if they are in the same shopping district or shopping center. Situated in one shopping center could be a branch of an apparel chain with a dis­tinctive image and customers willing to travel up to 20 miles and a shoe store regarded as average and customers willing to travel up to 5 miles. When one store has a better assortment, promotes more, and/or creates a stronger image, it may then become a destination store and generate a trading area much larger than that of a competitor with a “me-too” appeal. To be a desination retailer, Dunkin’ Donuts uses the slogan “America Runs on Dunkin’.” A parasite store does not create its own traffic and has no real trading area of its own. It depends on people who are drawn to the location for other reasons. A magazine stand in a hotel lobby and a snack bar in a shopping center are parasites. People patronize the shops but they did not come to the location of these shops specifically to make a purchase.

The extent of a store/center trading area is affected by its own size. As a store or center gets larger, its trading area usually increases, because store or center size generally reflects the assort­ment of goods and services. Yet, trading areas do not grow proportionately with store or center size. As a rule, supermarket trading areas are bigger than those of convenience stores. Customers go to the supermarket because it offers a better product selection; they go to the convenience store because of the need for a couple of “fill-in” items. In a regional shopping center, department stores usually have the largest trading areas, followed by apparel stores; gift stores have comparatively small trading areas. See Figures 9-5 and 9-6.

Whenever potential shoppers are situated between two competing stores, the trading area is often reduced for each store. The size of each store’s trading area normally increases as the distance between stores grows (target markets do not overlap as much). On the other hand, when stores are very near one another, the size of each store’s trading area does not necessarily shrink. This store grouping may actually increase the trading area for each store if more consumers are attracted to the location due to the variety of goods and services. However, each store’s market penetration (its percentage of sales in the trading area) may be low with such competition. Also, the entry of a new store may change the shape or create gaps in the trading areas of existing stores.

In many urban communities, people are clustered in multiunit housing near the center of commerce. With such population density, it is worthwhile for a retailer to be quite close to consumers; trading areas tend to be small because there are several shopping districts in close proximity to one another, particularly for the most densely populated cities. In many suburbs, most people live in single-unit housing, which is more geographically spread out. To produce satisfactory sales volume in suburbia, a retailer needs to attract shoppers from a greater distance.

The inf luence of travel or driving time on a trading area may not be clear from the popula­tion’s geographic distribution. Physical barriers (toll bridges, poor roads, railroad tracks, one-way streets) usually reduce trading areas’ size and contribute to their odd shapes. Economic barriers, such as different sales taxes in two towns, also affect the size and shape of trading areas.

In a community where a newspaper or other local media are available, a retailer could afford to advertise and enlarge its trading area. If local media are not available, the retailer would have to weigh the costs of advertising in countywide or regional media against the possibilities of a big­ger trading area.

3. Delineating the Trading Area of an Existing Store

The size, shape, and characteristics of the trading area for an existing store—or shopping district or shopping center—can usually be delineated quite accurately. Store records (secondary data) or a special research study (primary data) can measure the trading area. And many firms offer computer-generated maps that can be tailored to individual retailers’ needs.

Store records can reveal customer addresses. For credit customers, the data can be obtained from a retailer’s billing department; for cash customers, addresses can be acquired by analyzing deliveries, cash sales slips, store contests (sweepstakes), and checks. In both instances, the task is relatively inexpensive and quick because the data were originally collected for other purposes and are readily available.

Because many big retailers have computerized credit-card systems, they can define primary, secondary, and fringe trading areas in terms of the following:

  • The frequency with which people from various geographic locales shop at a particular store
  • The average-dollar purchases at a store by people from given geographic locales
  • The concentration of a store’s credit-card holders from given geographic locales

Although it is easy to get data on credit-card customers, the analysis may be invalid if cash custom­ers are not also studied. Credit use may vary among shoppers from different locales, especially if consumer traits in the locales are dissimilar. A firm reduces this problem if both cash and credit customers are studied.

A retailer can also collect primary data to determine trading-area size. It can record license plate numbers of cars parked near a store, find general addresses of those vehicle owners by con­tacting the state motor vehicle office, and then note them on a map. Typically, only the ZIP code and street of residence are given to protect people’s privacy. In license plate analysis, nondrivers and passengers—customers who walk to a store, use mass transit, or are driven by others—should not be omitted. To collect data on these people, questions must often be asked (survey).

If a retailer desires more demographic and lifestyle information about consumers in particular areas, it can buy the data. PRIZM (now owned by Nielsen) is a system for identifying communities by lifestyle clusters. It identifies 66 neighborhood types, including “Upward Bound,” “Blue-Chip Blues,” and “Suburban Sprawl.” This system was originally based on ZIP codes; it now also incorporates census tracts, block groups and enumeration districts, phone exchanges, and postal routes. Online PRIZM reports can be downloaded for as little as a few hundred dollars; costs are higher if reports are tailored to the individual retailer.

No matter how a trading area is delineated, a time bias may exist. A downtown business district is patronized by different customers during the week (those who work there) than on weekends (those who travel there to shop). Special events may attract people from great distances for only a brief time. Thus, an accurate estimate of a store’s trading area requires complete and continuous investigation.

After delineating a trading area, the retailer should map people’s locations and densities— either manually or with GIS software. In the manual method, a paper map of the area around a store is used. Different color dots or pins are placed on this map to represent population locations and densities, incomes, and other factors. Customer locations and densities are then indicated; primary, secondary, and fringe trading areas are denoted by ZIP code. Customers can be lured by promotions aimed at particular ZIP codes. With GIS software, vital customer data (such as purchase frequencies and amounts) are combined with other sources (such as census data) to yield computer-generated digitized maps depicting primary, secondary, and fringe trading areas.

4. Delineating the Trading Area of a New Store

A new store opening in an established trading area can use the methods just cited. The discussion in this section refers to a trading area with less-defined shopping and traffic patterns. Such an area must normally be evaluated in terms of opportunities rather than current patronage and traffic (pedestrian and vehicular) patterns. Accordingly, additional tools must be utilized.

Trend analysis—projecting the future based on the past—can be used by examining govern­ment and other data for predictions about population location, auto registrations, new housing starts, mass transportation, highways, zoning, and so on. With consumer surveys, data can be gathered about the time and distance people would be willing to travel to various retail locations, factors attracting people to a new store, addresses of those most apt to visit a new store, and other topics. Either technique may be a basis for delineating alternate new store trading areas.

Three computerized trading-area models are available for assessing new store locations:

  1. An analog model is the simplest and most popular trading-area analysis tool. Potential sales for a new store are estimated on the basis of revenues for similar stores in existing areas, the competition at a prospective location, the new store’s expected market share at that location, and the size and density of the location’s primary trading area.
  2. A regression model uses a series of mathematical equations showing the association between potential store sales and several independent variables at each location, such as population size, average income, the number of households, nearby competitors, transportation barriers, and traffic patterns.
  3. A gravity model is based on the premise that people are drawn to stores that are closer and more attractive than competitors’ stores. The distance between consumers and com­petitors, the distance from consumers to a given site, and store image can be included in this model.

Computerized trading-area models offer several benefits to retailers: (1) They operate in an objective and systematic way. (2) They offer insights as to how each locational attribute should be weighted. (3) They are useful in screening a large number of locations. (4) They can assess management performance by comparing forecasts with results.

More specific methods for delineating new trading areas are described next.9

REILLY’S LAW The traditional means of trading-area delineation is Reilly’s law of retail gravita­tion.10 It establishes a point of indifference between two cities or communities, so the trading area of each can be determined. The point of indifference is the geographic breaking point between two cities (communities) at which consumers are indifferent to shopping at either. According to Reilly’s law, more people go to a larger city or community because there are more stores; the assortment makes travel time worthwhile. Reilly’s law rests on these assumptions: Two competing areas are equally accessible from a major road, and retailers in the two areas are equally effective. Other factors (such as population dispersion) are held constant or ignored.

The law may be expressed algebraically as:11

where

Dab = Limit of city (community) A’s trading area, measured in miles along the road to city (community) B

d = Distance in miles along a major roadway between cities (communities) A and B

Pa = Population of city (community) A

Pb = Population of city (community) B

A city with a population of 90,000 (A) would draw people from three times the distance as a city with 10,000 (B). If the cities are 20 miles apart, the point of indifference for the larger city is 15 miles, and for the smaller city, it is 5 miles:

Reilly’s law is an important contribution to trading-area analysis because of its ease of cal­culation. It is most useful when other data are not available or when compiling other data is costly. Nonetheless, Reilly’s law has three limitations: (1) Distance is measured only by major thoroughfares; some people will travel shorter distances along streets that cross major thorough­fares. (2) Travel time does not necessarily reflect the distance traveled. Many people are more concerned about time than distance. (3) Actual distance may not correspond with the perceptions of distance. A store with few services and crowded aisles is apt to be a greater perceived distance from a person than a similarly located store with a more pleasant atmosphere.

HUFF’S LAW Huff’s law of shopper attraction delineates trading areas on the basis of the prod­uct assortment (of the items desired by the consumer) carried at various shopping locations, travel times from the shopper’s home to alternative locations, and the sensitivity of the kind of shopping to travel time. Assortment is rated by the total square feet of selling space a retailer expects all firms in a shopping area to allot to a product category. Sensitivity to the kind of shopping entails the trip’s purpose (restocking versus shopping) and the type of good/service sought (such as cloth­ing versus groceries).12

Huff’s law is expressed as:

where

Pij = Probability of a consumer’s traveling from home i to shopping location j

Sj = Square footage of selling space in shopping location j expected to be devoted to a particular product category

Tij = Travel time from consumer’s home i to shopping location j

A = Parameter used to estimate the effect of travel time on different kinds of shopping trips

n = Number of different shopping locations

Note that A must be determined through research or by a computer program.

Assume a leased department operator studies three possible locations with 200, 300, and 500 total square feet of store space allocated to men’s cologne (by all retailers in the areas). A group of potential customers lives 7 minutes from the first location, 10 minutes from the second, and 15 minutes from the third. The operator estimates the effect of travel time to be 2. Therefore, the probability of consumers’ shopping is 43.9 percent for Location 1, 32.2 percent for Location 2, and 23.9 percent for Location 3:

If 200 shoppers for men’s cologne live 7 minutes from Location 1, about 88 of them will shop there.

These points should be considered in using Huff’s law:

  • To determine Location 1’s trading area, similar computations would be made for shoppers liv­ing at a driving time of 10, 15, 20 minutes, and so on. The number of shoppers at each distance who would shop there are then summed. Thus, stores in Location 1 could estimate their total market, trading-area size, and primary, secondary, and fringe areas for a product category.
  • If new retail facilities in a product category are added to a locale, the percentage of shoppers living at every travel time from that location who would shop there goes up.
  • The probability of people shopping at a location depends on the effect of travel time. If a product is important, such as dressy watches, consumers are less travel sensitive. A A of 1 leads to these figures: Location 1, 31.1 percent; Location 2, 32.6 percent; and Location 3, 36.3 percent (based on the space in the cologne example). Location 3 would be popular for the watches due to assortment.
  • All the variables are rather hard to calculate; for mapping purposes, travel time must be con­verted to miles. Travel time also depends on the transportation form used.
  • Since people buy different items on different shopping trips, the trading area varies by trip.

Today, the Huff model is utilized in such GIS software as Esri’s ArcGIS Business Analyst.

OTHER TRADING-AREA RESEARCH Over the years, many researchers have examined trading- area size in a variety of settings. They have introduced additional factors and advanced statistical techniques to explain the consumer’s choice of shopping location. Here are some examples.

In his model, Gautschi added to Huff’s analysis by including shopping-center descriptors and transportation conditions. Weisbrod, Parcells, and Kern studied shopping-center appeal on the basis of expected population changes, store characteristics, and the transportation network. Bell, Ho, and Tang devised a model with fixed and variable store-choice factors. Rogers examined the role of human decision making versus computer-based models in site choice. Rajagopal studied shopping attractions, routes to shopping, and establishing customer-centric strategies. Dolega, Pavlis, and Singleton extended the retail store attractiveness and catchment model from a single store or shopping center to a national network of retail centers.13

Source: Barry Berman, Joel R Evans, Patrali Chatterjee (2017), Retail Management: A Strategic Approach, Pearson; 13th edition.