The first step in choosing a retail store location is to describe and assess alternate trading areas and then choose the best one. A trading area is a geographical area containing the customers and potential customers of a particular retailer or group of retailers for specific goods and/or services. The size of a trading area typically reflects the boundaries within which it is profitable to sell and/ or deliver products.2 After a trading area is selected, it should be reviewed regularly.
A thorough analysis of trading areas provides several benefits:
- Consumer demographic and socioeconomic characteristics are examined. For a new store, the study of proposed trading areas reveals opportunities and the retail strategy needed to succeed. For an existing store, it can be determined if the current strategy still matches consumer needs. The focus of promotional activities is ascertained, and the retailer can look at media coverage patterns of proposed or existing locations. If 95 percent of customers live within 3 miles of a store, it would be inefficient to advertise in a paper with a citywide audience.
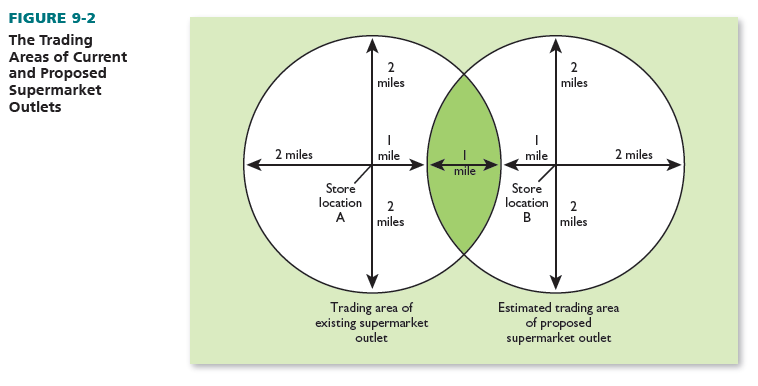
- A chain retailer learns whether the location of a proposed new store will reach additional customers or take business from existing stores. Suppose a supermarket chain has a store in Jackson, Mississippi, with a trading area of 2 miles, and it considers adding a new store, three miles from the Jackson branch. Figure 9-2 shows the distinct trading areas and expected store overlap. The shaded portion represents the trading-area overlap, where the same customers are served by both branches. The chain must look at the overall net increase in sales if it adds the proposed store (total revised sales of existing store + total sales of new store — total previous sales of existing store).
- Chains anticipate whether competitors want to open nearby stores if the firm does not do so itself. That is why TJX has two of its chains, T. J. Maxx and Marshalls, situate within 1.5 miles of each other in more than 100 U.S. markets, even though they are both off-price apparel firms.
- The best number of stores for a chain to operate in a given area is calculated. How many outlets should a retailer have in a region to provide good service for customers (without raising costs too much or having too much overlap)? When CVS pharmacy entered Atlanta, it opened nine new drugstores in one day. This gave it enough coverage of the city to service residents, without placing stores too close together. A major competitive advantage for Canadian Tire Corporation is that four-fifths of the Canadian population lives within a 15-minute drive of a Canadian Tire store.
- Geographic weaknesses are highlighted. Suppose a suburban shopping center does an analysis and finds that most of those residing south of town do not shop there, and a more comprehensive study reveals that people are afraid to drive past a dangerous railroad crossing. Due to its research, the shopping center could exert political pressure to make the crossing safer.
- The impact of the Internet is taken into account. Store-based retailers must examine trading areas more carefully than ever to see how their customers’ shopping behavior is changing due to the Web.
- Other factors are reviewed. The competition, financial institutions, transportation, labor availability, supplier location, legal restrictions, and so on can each be learned for the trading area(s) examined.
1. The Use of Geographic Information Systems in Trading-Area Delineation and Analysis
Increasingly, retailers are using geographic information system (GIS) software, which combines digitized mapping with key locational data to graphically depict trading-area characteristics such as population demographics; data on customer purchases; and listings of current, proposed, and competitor locations. Commercial GIS software lets firms quickly research the attractiveness of different locations and access computer-generated maps. Before, retailers often placed different color pins on paper maps to show current and proposed locales—and competitors’ sites—and had to collect and analyze data.3
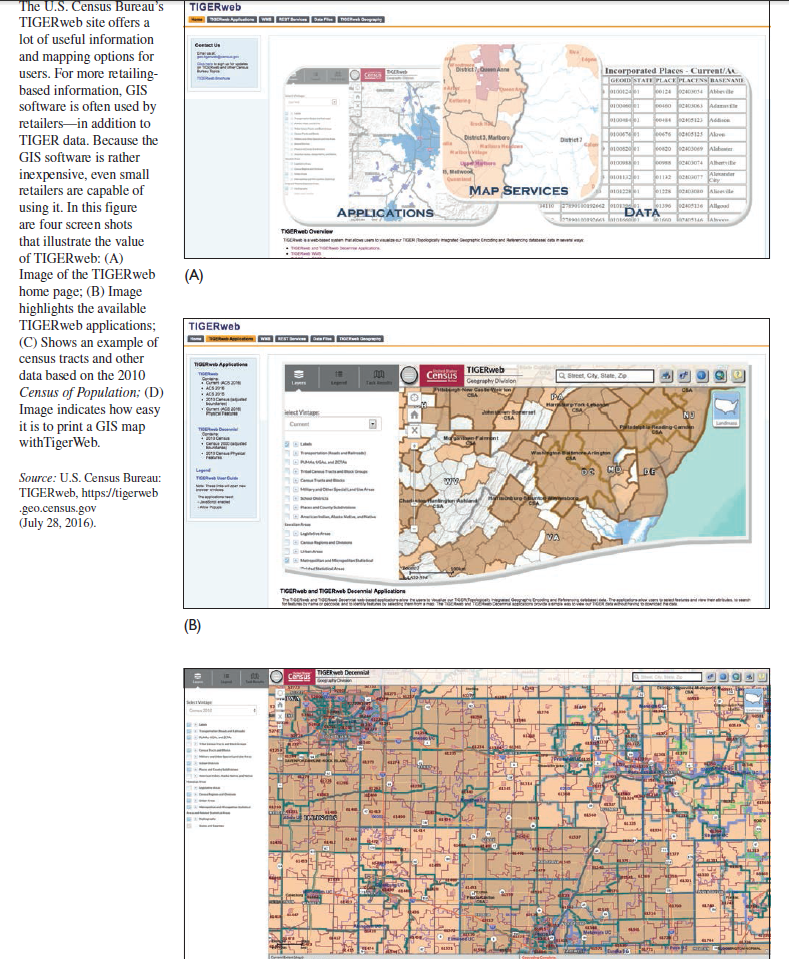
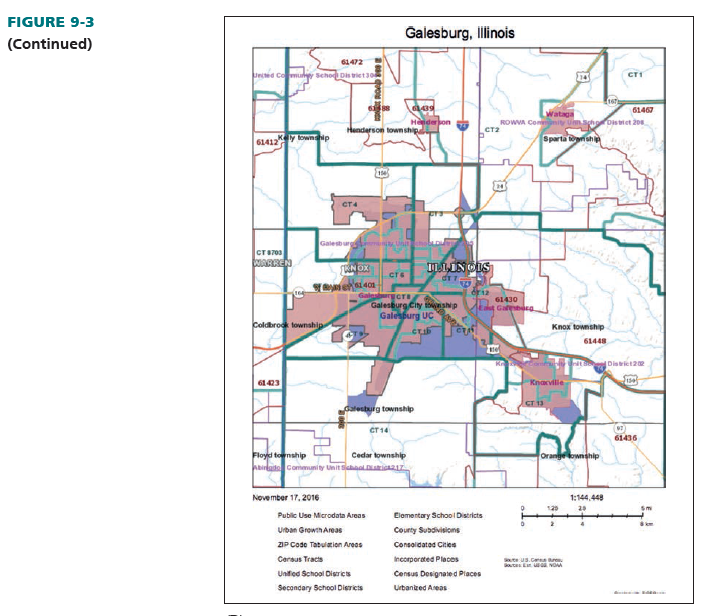
Most GIS software programs are extrapolated from the decennial Census of Population and the U.S. Census Bureau’s national digital map (known as TIGER—topologically integrated geographic encoding and referencing).4 TIGER incorporates all streets and highways in the United States. TIGER files may be accessed online free using its web-based platform TIGERweb or as Shapefiles downloads. TIGERweb’s Web Map Service (WMS) maps may be adapted to reflect census tracts, railroads, highways, waterways, and other physical attributes of any U.S. area, but they do not show retailers or other commercial entities. Many versions of the TIGER data are available for download and adaptation based on level of detail.5 See Figure 9-3 shows the breadth of TIGER services.
Mapping software from private firms have many more enhancements than TIGER does. These firms often offer free demonstrations, but they expect to be paid for their software. Although GIS applications differ by vendor, they generally can be accessed or bought for as little as $100 (or less) or for as much as several thousand dollars. They are designed to work with personal computers, and allow for some manipulation of trading-area data.
Private firms that offer mapping software include:
- Alteryx (http://analytics.alteryx.com/spatial-analytics)
- Autodesk (http://usa.autodesk.com)
- Caliper Corporation (caliper.com)
- Esri (esri.com)
- geoVue (geovue.com)
- Kalibrate (kalibrate.com/market-intel-cloud)
- Nielsen’s Claritas Location Mapping (http://goo.gl/iiNj8T)
- Pitney Bowes Location Intelligence (www.pitneybowes.com/us/location-intelligence.html)
- Tele Mart GIS Mapping (www.tele-mart.com/gis-mapping.php)
- Tetrad (www.tetrad.com)
Many of these companies have free demonstrations at their Web sites.
Geographic information system software can be applied in various ways. A chain retailer could learn which of its stores have trading areas with households having a median annual income of more than $50,000. That firm could derive the sales potential of proposed new store locations and their potential effect on sales at existing stores. It could also use software to learn the demographics of customers at its best locations and set up a computer model to find potential locations with the most desired attributes. A retailer could even use the software to pinpoint its geographic areas of strength and weakness.
These three examples show how retailers benefit from GIS software:
- Starbucks uses GIS software from Esri to create and use store location data, maps, and models through employee desktops, in browsers, or on mobile devices. A new capability of this software is its ability to generate “heat maps” that depict the distribution of Starbucks locations. The points on the GIS maps can be grouped on a small scale to analyze regional patterns and on a large scale to view patterns within a metropolitan area. The heat maps depict the density of Starbucks locations. The Esri-based software provides Starbucks with data on population demographics, population density, auto traffic patterns, public transportation, and the types of nearby stores. Starbucks uses the data in making decisions about new store openings as well as menu options tailored to the store.6
- Walgreens has used GIS technology since 2000. Its new system, called WalMap, contains interactive maps that can be used to determine the best place to locate a new store on the basis of demographic trends, competitor locations, and sales trend data. This software, which can be viewed on an iPad, contains location-specific data so store managers and Walgreens’ corporate-level real-estate team can use the information. With the use of mobile devices, managers no longer have to print out maps to access important information.7
- GFK GeoMarketing offers GIS software services that assist international retailers that want to expand overseas. The software helps find best locations for store networks, identifying regional target groups, and determining product demand. RegioGraph helps retailers analyze and visualize their data on digital maps.8
2. The Size and Shape of Trading Areas
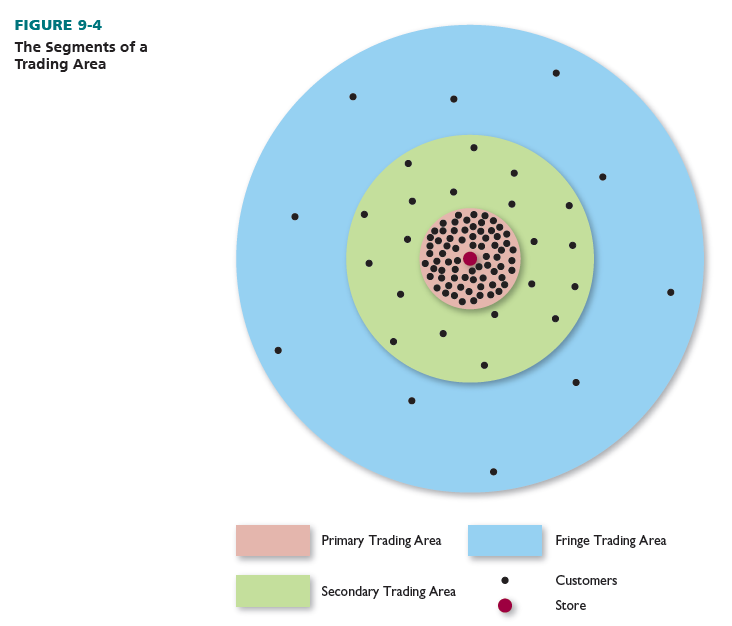
Each trading area has three parts: The primary trading area encompasses 50 to 80 percent of a store’s customers. It is the area closest to the store and possesses the highest density of customers to population and the highest per capita sales. There is little overlap with other trading areas. The secondary trading area contains an additional 15 to 25 percent of a store’s customers. It is located outside the primary area, and customers are more widely dispersed. The fringe trading area includes all the remaining customers, and they are the most widely dispersed. A store could have a primary trading area of 4 miles, a secondary trading area of 5 miles, and a fringe trading area of 10 miles. The fringe trading area typically includes some outshoppers who travel greater distances to patronize certain stores.
Figure 9-4 shows the makeup of trading areas and their segments. In reality, trading areas do not usually follow such circular patterns. They adjust to the physical environment. The size and shape are affected by store type, store size, location of competitors, housing patterns, travel time and traffic barriers (such as toll bridges), and media access. These factors are discussed next.
Two stores can have different trading areas even if they are in the same shopping district or shopping center. Situated in one shopping center could be a branch of an apparel chain with a distinctive image and customers willing to travel up to 20 miles and a shoe store regarded as average and customers willing to travel up to 5 miles. When one store has a better assortment, promotes more, and/or creates a stronger image, it may then become a destination store and generate a trading area much larger than that of a competitor with a “me-too” appeal. To be a desination retailer, Dunkin’ Donuts uses the slogan “America Runs on Dunkin’.” A parasite store does not create its own traffic and has no real trading area of its own. It depends on people who are drawn to the location for other reasons. A magazine stand in a hotel lobby and a snack bar in a shopping center are parasites. People patronize the shops but they did not come to the location of these shops specifically to make a purchase.
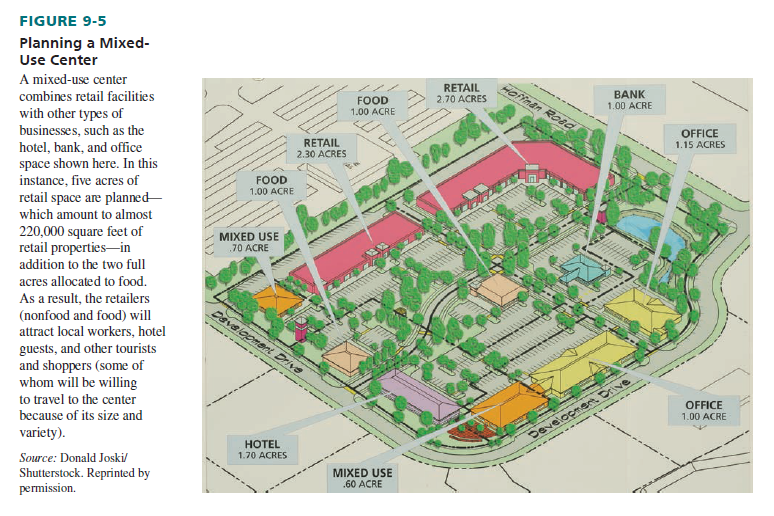
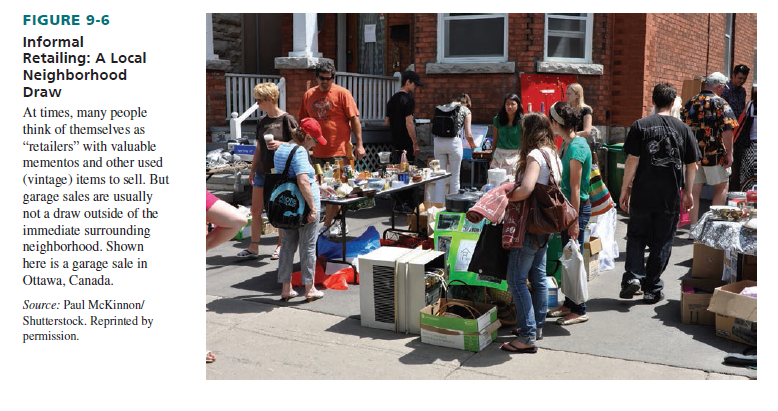
The extent of a store/center trading area is affected by its own size. As a store or center gets larger, its trading area usually increases, because store or center size generally reflects the assortment of goods and services. Yet, trading areas do not grow proportionately with store or center size. As a rule, supermarket trading areas are bigger than those of convenience stores. Customers go to the supermarket because it offers a better product selection; they go to the convenience store because of the need for a couple of “fill-in” items. In a regional shopping center, department stores usually have the largest trading areas, followed by apparel stores; gift stores have comparatively small trading areas. See Figures 9-5 and 9-6.
Whenever potential shoppers are situated between two competing stores, the trading area is often reduced for each store. The size of each store’s trading area normally increases as the distance between stores grows (target markets do not overlap as much). On the other hand, when stores are very near one another, the size of each store’s trading area does not necessarily shrink. This store grouping may actually increase the trading area for each store if more consumers are attracted to the location due to the variety of goods and services. However, each store’s market penetration (its percentage of sales in the trading area) may be low with such competition. Also, the entry of a new store may change the shape or create gaps in the trading areas of existing stores.
In many urban communities, people are clustered in multiunit housing near the center of commerce. With such population density, it is worthwhile for a retailer to be quite close to consumers; trading areas tend to be small because there are several shopping districts in close proximity to one another, particularly for the most densely populated cities. In many suburbs, most people live in single-unit housing, which is more geographically spread out. To produce satisfactory sales volume in suburbia, a retailer needs to attract shoppers from a greater distance.
The inf luence of travel or driving time on a trading area may not be clear from the population’s geographic distribution. Physical barriers (toll bridges, poor roads, railroad tracks, one-way streets) usually reduce trading areas’ size and contribute to their odd shapes. Economic barriers, such as different sales taxes in two towns, also affect the size and shape of trading areas.
In a community where a newspaper or other local media are available, a retailer could afford to advertise and enlarge its trading area. If local media are not available, the retailer would have to weigh the costs of advertising in countywide or regional media against the possibilities of a bigger trading area.
3. Delineating the Trading Area of an Existing Store
The size, shape, and characteristics of the trading area for an existing store—or shopping district or shopping center—can usually be delineated quite accurately. Store records (secondary data) or a special research study (primary data) can measure the trading area. And many firms offer computer-generated maps that can be tailored to individual retailers’ needs.
Store records can reveal customer addresses. For credit customers, the data can be obtained from a retailer’s billing department; for cash customers, addresses can be acquired by analyzing deliveries, cash sales slips, store contests (sweepstakes), and checks. In both instances, the task is relatively inexpensive and quick because the data were originally collected for other purposes and are readily available.
Because many big retailers have computerized credit-card systems, they can define primary, secondary, and fringe trading areas in terms of the following:
- The frequency with which people from various geographic locales shop at a particular store
- The average-dollar purchases at a store by people from given geographic locales
- The concentration of a store’s credit-card holders from given geographic locales
Although it is easy to get data on credit-card customers, the analysis may be invalid if cash customers are not also studied. Credit use may vary among shoppers from different locales, especially if consumer traits in the locales are dissimilar. A firm reduces this problem if both cash and credit customers are studied.
A retailer can also collect primary data to determine trading-area size. It can record license plate numbers of cars parked near a store, find general addresses of those vehicle owners by contacting the state motor vehicle office, and then note them on a map. Typically, only the ZIP code and street of residence are given to protect people’s privacy. In license plate analysis, nondrivers and passengers—customers who walk to a store, use mass transit, or are driven by others—should not be omitted. To collect data on these people, questions must often be asked (survey).
If a retailer desires more demographic and lifestyle information about consumers in particular areas, it can buy the data. PRIZM (now owned by Nielsen) is a system for identifying communities by lifestyle clusters. It identifies 66 neighborhood types, including “Upward Bound,” “Blue-Chip Blues,” and “Suburban Sprawl.” This system was originally based on ZIP codes; it now also incorporates census tracts, block groups and enumeration districts, phone exchanges, and postal routes. Online PRIZM reports can be downloaded for as little as a few hundred dollars; costs are higher if reports are tailored to the individual retailer.
No matter how a trading area is delineated, a time bias may exist. A downtown business district is patronized by different customers during the week (those who work there) than on weekends (those who travel there to shop). Special events may attract people from great distances for only a brief time. Thus, an accurate estimate of a store’s trading area requires complete and continuous investigation.
After delineating a trading area, the retailer should map people’s locations and densities— either manually or with GIS software. In the manual method, a paper map of the area around a store is used. Different color dots or pins are placed on this map to represent population locations and densities, incomes, and other factors. Customer locations and densities are then indicated; primary, secondary, and fringe trading areas are denoted by ZIP code. Customers can be lured by promotions aimed at particular ZIP codes. With GIS software, vital customer data (such as purchase frequencies and amounts) are combined with other sources (such as census data) to yield computer-generated digitized maps depicting primary, secondary, and fringe trading areas.
4. Delineating the Trading Area of a New Store
A new store opening in an established trading area can use the methods just cited. The discussion in this section refers to a trading area with less-defined shopping and traffic patterns. Such an area must normally be evaluated in terms of opportunities rather than current patronage and traffic (pedestrian and vehicular) patterns. Accordingly, additional tools must be utilized.
Trend analysis—projecting the future based on the past—can be used by examining government and other data for predictions about population location, auto registrations, new housing starts, mass transportation, highways, zoning, and so on. With consumer surveys, data can be gathered about the time and distance people would be willing to travel to various retail locations, factors attracting people to a new store, addresses of those most apt to visit a new store, and other topics. Either technique may be a basis for delineating alternate new store trading areas.
Three computerized trading-area models are available for assessing new store locations:
- An analog model is the simplest and most popular trading-area analysis tool. Potential sales for a new store are estimated on the basis of revenues for similar stores in existing areas, the competition at a prospective location, the new store’s expected market share at that location, and the size and density of the location’s primary trading area.
- A regression model uses a series of mathematical equations showing the association between potential store sales and several independent variables at each location, such as population size, average income, the number of households, nearby competitors, transportation barriers, and traffic patterns.
- A gravity model is based on the premise that people are drawn to stores that are closer and more attractive than competitors’ stores. The distance between consumers and competitors, the distance from consumers to a given site, and store image can be included in this model.
Computerized trading-area models offer several benefits to retailers: (1) They operate in an objective and systematic way. (2) They offer insights as to how each locational attribute should be weighted. (3) They are useful in screening a large number of locations. (4) They can assess management performance by comparing forecasts with results.
More specific methods for delineating new trading areas are described next.9
REILLY’S LAW The traditional means of trading-area delineation is Reilly’s law of retail gravitation.10 It establishes a point of indifference between two cities or communities, so the trading area of each can be determined. The point of indifference is the geographic breaking point between two cities (communities) at which consumers are indifferent to shopping at either. According to Reilly’s law, more people go to a larger city or community because there are more stores; the assortment makes travel time worthwhile. Reilly’s law rests on these assumptions: Two competing areas are equally accessible from a major road, and retailers in the two areas are equally effective. Other factors (such as population dispersion) are held constant or ignored.
The law may be expressed algebraically as:11
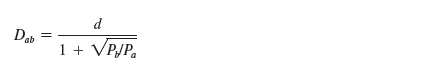
where
Dab = Limit of city (community) A’s trading area, measured in miles along the road to city (community) B
d = Distance in miles along a major roadway between cities (communities) A and B
Pa = Population of city (community) A
Pb = Population of city (community) B
A city with a population of 90,000 (A) would draw people from three times the distance as a city with 10,000 (B). If the cities are 20 miles apart, the point of indifference for the larger city is 15 miles, and for the smaller city, it is 5 miles:
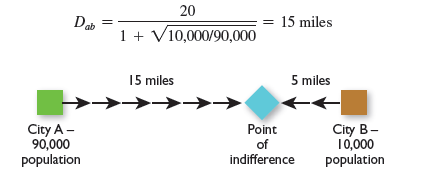
Reilly’s law is an important contribution to trading-area analysis because of its ease of calculation. It is most useful when other data are not available or when compiling other data is costly. Nonetheless, Reilly’s law has three limitations: (1) Distance is measured only by major thoroughfares; some people will travel shorter distances along streets that cross major thoroughfares. (2) Travel time does not necessarily reflect the distance traveled. Many people are more concerned about time than distance. (3) Actual distance may not correspond with the perceptions of distance. A store with few services and crowded aisles is apt to be a greater perceived distance from a person than a similarly located store with a more pleasant atmosphere.
HUFF’S LAW Huff’s law of shopper attraction delineates trading areas on the basis of the product assortment (of the items desired by the consumer) carried at various shopping locations, travel times from the shopper’s home to alternative locations, and the sensitivity of the kind of shopping to travel time. Assortment is rated by the total square feet of selling space a retailer expects all firms in a shopping area to allot to a product category. Sensitivity to the kind of shopping entails the trip’s purpose (restocking versus shopping) and the type of good/service sought (such as clothing versus groceries).12
Huff’s law is expressed as:
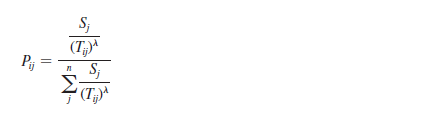
where
Pij = Probability of a consumer’s traveling from home i to shopping location j
Sj = Square footage of selling space in shopping location j expected to be devoted to a particular product category
Tij = Travel time from consumer’s home i to shopping location j
A = Parameter used to estimate the effect of travel time on different kinds of shopping trips
n = Number of different shopping locations
Note that A must be determined through research or by a computer program.
Assume a leased department operator studies three possible locations with 200, 300, and 500 total square feet of store space allocated to men’s cologne (by all retailers in the areas). A group of potential customers lives 7 minutes from the first location, 10 minutes from the second, and 15 minutes from the third. The operator estimates the effect of travel time to be 2. Therefore, the probability of consumers’ shopping is 43.9 percent for Location 1, 32.2 percent for Location 2, and 23.9 percent for Location 3:
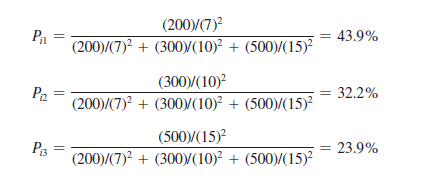
If 200 shoppers for men’s cologne live 7 minutes from Location 1, about 88 of them will shop there.
These points should be considered in using Huff’s law:
- To determine Location 1’s trading area, similar computations would be made for shoppers living at a driving time of 10, 15, 20 minutes, and so on. The number of shoppers at each distance who would shop there are then summed. Thus, stores in Location 1 could estimate their total market, trading-area size, and primary, secondary, and fringe areas for a product category.
- If new retail facilities in a product category are added to a locale, the percentage of shoppers living at every travel time from that location who would shop there goes up.
- The probability of people shopping at a location depends on the effect of travel time. If a product is important, such as dressy watches, consumers are less travel sensitive. A A of 1 leads to these figures: Location 1, 31.1 percent; Location 2, 32.6 percent; and Location 3, 36.3 percent (based on the space in the cologne example). Location 3 would be popular for the watches due to assortment.
- All the variables are rather hard to calculate; for mapping purposes, travel time must be converted to miles. Travel time also depends on the transportation form used.
- Since people buy different items on different shopping trips, the trading area varies by trip.
Today, the Huff model is utilized in such GIS software as Esri’s ArcGIS Business Analyst.
OTHER TRADING-AREA RESEARCH Over the years, many researchers have examined trading- area size in a variety of settings. They have introduced additional factors and advanced statistical techniques to explain the consumer’s choice of shopping location. Here are some examples.
In his model, Gautschi added to Huff’s analysis by including shopping-center descriptors and transportation conditions. Weisbrod, Parcells, and Kern studied shopping-center appeal on the basis of expected population changes, store characteristics, and the transportation network. Bell, Ho, and Tang devised a model with fixed and variable store-choice factors. Rogers examined the role of human decision making versus computer-based models in site choice. Rajagopal studied shopping attractions, routes to shopping, and establishing customer-centric strategies. Dolega, Pavlis, and Singleton extended the retail store attractiveness and catchment model from a single store or shopping center to a national network of retail centers.13
Source: Barry Berman, Joel R Evans, Patrali Chatterjee (2017), Retail Management: A Strategic Approach, Pearson; 13th edition.
Nice post. I used to be checking continuously this weblog and I’m impressed! Extremely helpful info specially the closing section 🙂 I care for such information much. I was looking for this certain information for a very long time. Thank you and good luck.
I’m not certain the place you are getting your information, but good topic. I needs to spend a while finding out more or figuring out more. Thanks for great information I used to be on the lookout for this information for my mission.