1. Different Things to Check and Report
As described earlier in this book, a model does not necessarily have reflective measurements. When working with model that utilizes a formative measurement scale, we do not analyze indicator reliability, internal consistency reliability, or discriminant validity because the formative indicators are not highly correlated together. Instead, we analyze the model’s outer weight, convergent validity, and collinearity of indicators. In terms of the inner “structural” model, we should check and report the same items as shown in previous chapter. To recap, the followings should be reported if you have a formative measurement model:
- Explanation of target endogenous variable variance
- Inner model path coefficient sizes and significance
- Outer model weight and significance
- Convergent validity
- Collinearity among indicators
- Checking Structural Path Significance in Bootstrapping
- Multicollinearity Assessment
- Model’s f Effect Size
- Predictive Relevance: The Stone-Geisser’s (Q2) Values
- T otal Effect V alue
2. Outer Model Weight and Significance
For models with formative measurement scale, the outer weights can be found using the path (PLS -> Calculation Results Outer Weight) after the PLS algorithm is run. Marketers should pay attention to those indicators with high outer weights as they are the important area or aspect of the business that should be focused on.
In SmartPLS, bootstrapping can also be used to test the significance of formative indicators’ outer weight. After running the procedure, check the T-Statistics value as shown in the “Outer Weights” window (Bootstrapping Bootstrapping -J Outer Weights [Mean, STDEV, T’-Values]). If a particular indicator’s outer weight is shown as not significant (i.e., <1.96), check the significance of its outer loading. Only remove the indicator if both of its outer weights and outer loadings are not significant.
3. Convergent Validity
To establish convergent validity, a “redundancy analysis” can be carried out for each latent variable separately. This involves the use of an existing formative latent variable as an exogenous latent variable to predict an endogenous latent variable operationalized through one or more reflectively measured indicators (see Figure 25).
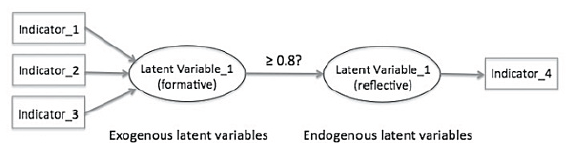
Figure 25: Redundancy Analysis for Assessing Convergent Validity
The reflective indicator (“Indicator_4” as in Figure 25) can be a global item in the questionnaire that summarizes the essence of the latent variable the formative indicators (“Indicator_1”, “Indicator_2”, and “Indicator_3”) intend to measure. For example, if the “Latent Variable_1” is about Corporate Social Responsibility, a survey question such as “Please evaluate to what degree this organization acted in a socially responsible way?” can be asked on a Likert scale of 0 (not a all) to 7 (completely), and this is the data for “Indicator_4”.
To do this in SmartPLS, a new model has to be built for each latent variable for PLS-SEM testing. When the correlation (path coefficient) between the latent variables is 0.80 or higher, convergent validity is established (Hair et al., 2013).
4. Collinearity of Indicators
In a formative measurement model, the problem of indicator collinearity may occur if the indicators are highly correlated to each other. As discussed earlier in the book, multiple regression in SPSS can be used to generate VIF and Tolerance values for collinearity checking. The formative indicators of a latent variable are set as independent variables, with the indicator of another latent variable as dependent variable. In the “Statistics..” window, check “Estimates”, “Model Fit” and “Collinearity diagnostics”. Once the linear regression is run, locate the “Coefficients” table in the SPSS Output. Only the Tolerance and VIF values showing in the “Collinearity Statistics” column are needed for this collinearity analysis. See Figure 26 for an example.
Figure 26: Tolerance and VIF Values in SPSS Output
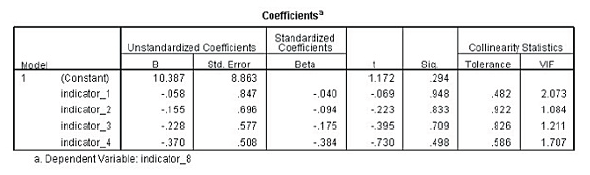
Looking at a fictitious example as shown in Figure 26, all of the indicators’ VIF values are lower than 5 and their Tolerance values are higher than 0.2, so there is no collinearity problem.
5. Model Having Both Reflective and Formative Measurements
It is important to note that in some research projects, both reflective and formative measurements are present in the same model. In other words, some latent variables have arrows pointing away from them, whereas there are also latent variables that have arrows pointing to them from their indicators. If this is the case, analysis should be carried out separately for each part of the model. Outer loadings and outer weights have to be examined carefully for reflective and formative indicators respectively.
Source: Ken Kwong-Kay Wong (2019), Mastering Partial Least Squares Structural Equation Modeling (Pls-Sem) with Smartpls in 38 Hours, iUniverse.
28 Sep 2021
28 Sep 2021
23 Oct 2019
28 Sep 2021
28 Sep 2021
28 Sep 2021