1. Formative or Reflective? Determining the Measurement Model Quantitatively
Designing the measurement model in PLS-SEM is not always a straight-forward task. It has been a challenge for some researchers to determine if the relationship between the indicators and the latent variable is formative or reflective. This is particularly the case in Marketing when researchers are dealing with innovative products or services where sound theoretical frameworks have not yet been established.
By default, SmartPLS 3 displays a reflective measurement mode for the latent variable. That is, arrows are pointing from the “circular-shaped” latent variable to the “rectangular-shaped” indicators. This can be problematic if the researchers forget to reverse the direction of the arrows when building a formative measurement model. Fortunately, researchers can solve this issue in SmartPLS 3 by making use of a technique called Confirmatory Tetrad Analysis in PLS (CTA-PLS) that is developed by Gudergan, Ringle, Wende, and Will (2008). The only limitation is that CTA-PLS can only check latent variable that has at least 4 indicators associated with it.
The idea behind CTA-PLS is that in a reflective measurement model, each tetrad47 (t) is expected to be zero. Hence, if one or more of the tetrads in the measurement model is significantly different from zero, it is formative. In other words, CTA-PLS simply tests the following hypothesis:

2. Case Study: Customer Survey in a Cafe (B2C)
To illustrate various statistical procedures as presented in Chapter 6, 7 and 8, let us make use of a data set called “cafe100.csv”. In this chapter, CTA-PLS will be performed on this data set to check if we should use a reflective, formative, or a combined measurement model.
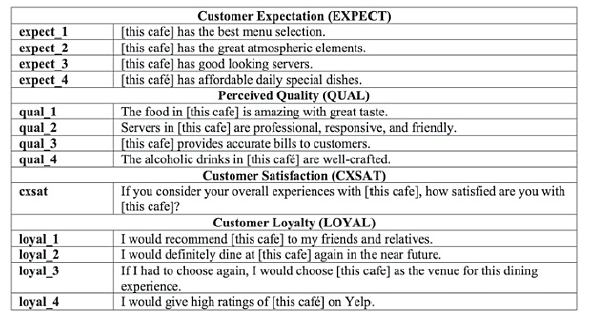
The data set is a modified version of the one that was originally presented by Wong (2013). A 13-question survey was conducted by a cafe owner to 100 cafe patrons to learn about their dining experience so that she can identify and prioritize the key business areas for improvement. Cafe patrons were asked to rate their experience on a 7-point Likert scales [(1) strongly disagree, (2) disagree, (3) somewhat disagree, (4) neither agree nor disagree, (5) somewhat agree, (6) agree, and (7) strongly agree)] regarding the following 4 major constructs: Customer Expectation (EXPECT), Perceived Quality (QUAL), Customer Satisfaction (CXSAT), and Customer Loyalty (LOYAL). We have also collected data about these cafe patrons in terms of their customer type (Cxtype; 1 is student, 2 is non-student) and also their loyalty program membership status (member; 1 is member, 2 is nonmember). The dataset file is called “cafe100.csv”. The indicators and corresponding survey statements are presented in Figure 27:
Figure 27: Indicators and Survey Details
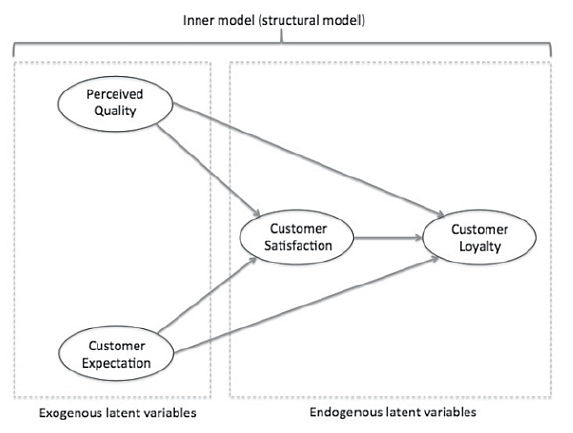
The corresponding theoretical framework is displayed in Figure 28.
Figure 28: Inner Model Design – Cafe Example.
3. CTA-PLS Procedures
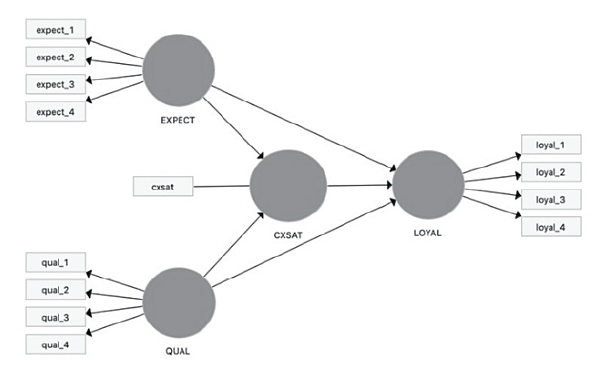
- Create a new project in SmartPLS using the “cafe100” dataset as in Figure 29.
Figure 29: Model for Cafe100 in SmartPLS
- Go to the “Calculate” menu and select “PLS Algorithm”. Using the following parameters, run the pathmodeling estimation by clicking the “Start Calculation” button:
- Weighting Scheme: Path
- Maximum Iterations: 500
- Stop Criterion (10A-X): 7
- Initial Weights: uncheck the box
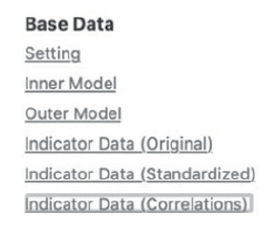
- Look at the bottom of the result page. Under the “Base Data” heading, select “Indicator Data (correlations)” (see Figure 30). Are the numbers mostly different from zero? If Yes, continue to step 4.
Figure 30: Indicator Data (Correlations)
- Go back to the “Cafe100.splsm” tab where your colorful model is located. Go to the “Calculate” menu and select “Confirmatory Tetrad Analyses (CTA)”. Run the estimation using the following parameters:
- Subsamples: 5000
- Do Parallel Processing: checked (ticked)
- Test Type: Two Tailed
- Significance level: 0.1
- Look at the bottom of the result page. Under the “Final Results” heading, click the hyperlink for the variable “EXPECT”.
- Scroll to the right to view the last 2 columns. Check the “CI Low adj.” and “CI Up adj.” columns to see if zero falls in-between these 2 values. If Yes, it is reflective (See Figure 31).
Figure 31: Confidence Interval Values
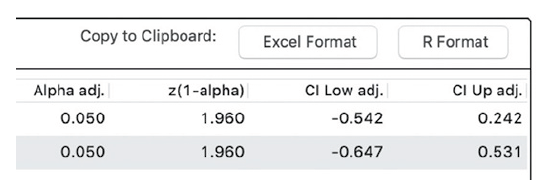
- In this example, there are two tetrads for the EXPECT variable. Since zero falls into this bias-corrected and Bonferroni-adjusted confidence interval, the tetra is not significantly different from zero, meaning it is having a “reflective” measurement model. As a result, we can safely use the default SmartPLS 3 setting to make the arrows pointing from the circular-shape EXPECT to the rectangular-shaped indicators when designing the model.
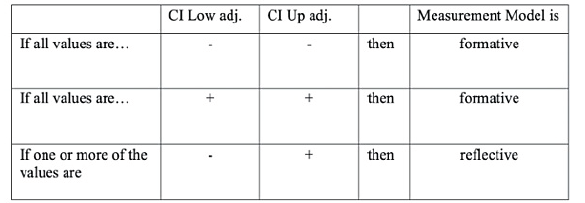
- The following Figure 32 may be used as a guideline to determine if the measurement model is formative or reflective:
Figure 32: Guideline for Using CI to Determine Measurement Model
- Following the same process, we check the other variables LOYAL and QUAL in the result report. It was found that LOYAL and QUAL were both having the reflective measurement model. As such, there is no need to change the arrow directions in our model as SmartPLS uses the reflective measurement model as the default setting.
- When CTA-PLS cannot be applied, such as having latent variable with 3 or fewer indicators, researchers should then make the formative vs. reflective decision based on sound theoretical considerations. As a rule of thumb, if the indicators hang well together and are highly interchangeable among themselves, it is a reflective measurement model. On the other hand, if the indicators are not highly correlated and they are not interchangeable, a formative measurement model is suggested (Wong, 2013).
Source: Ken Kwong-Kay Wong (2019), Mastering Partial Least Squares Structural Equation Modeling (Pls-Sem) with Smartpls in 38 Hours, iUniverse.
28 Sep 2021
28 Sep 2021
28 Sep 2021
28 Sep 2021
28 Sep 2021
23 Oct 2019