CIPD (2006a) notes that the UK labour force has gradually become more diverse particularly in terms of gender, age, race and ethnicity, sexual orientation, and political and religious beliefs. In choosing these groups we have clearly been selective, and indeed British Telecom have identified as many as 12 aspects of difference between employees (Liff 1999). It should also be noted that CIPD (2003) provides a much broader definition of diversity, going beyond social category diversity, as above, to include informational diversity (differences in terms of education, tenure and functional background) and value diversity (which includes differences in personality and attitudes).
We have therefore been selective in the groups we have chosen to discuss specifically in this initial section: women, racial/ethnic minorities, disabled people, older people and individuals who are lesbian, gay, bisexual or transsexual.
1. Women
If participation in the labour force is an indication of decreasing discrimination then recent figures are encouraging. From 1971 to 2005 the female participation rate in employment increased from 56.8 per cent to 70 per cent, compared with the male participation rate which is slowly falling, and now at 79 per cent (ONS, 2006) based on the spring 2005 Labour Force Survey. These trends are predicted to continue. Much of this increase has been due to the replacement of full-time jobs with part-time jobs, and indeed the same article reports that around 50 per cent of women are in part-time jobs compared with around one-sixth of men. Hakim (1993) concludes that only an increase in full-time employment is likely to have a wider impact on women’s opportunities at work and elsewhere.
Some of the more obvious signs of discrimination, such as in recruitment advertising, may have disappeared, and there is some evidence to suggest that women are beginning to enter some previously male-dominated occupations. For example, women have now been ordained as priests in the Church of England, and are plumbers and builders but not without deep and continuing debate. Similarly men are beginning to enter some previously female-only occupations, such as midwifery. However, there remains a high degree of subtle, for example in access to training and support for development and promotion, and not-so-subtle discrimination, as in the continued gender segregation in terms of both type and level of work undertaken. The EOC (2007) reports that only 10 per cent of FTSE directors, only 20 per cent of MPs, and 26 per cent of top civil servants are women. And historical evidence shows these figures do not always follow an upward trend. Higginbottom and Roberts (2002) report that the EOC found only 28 per cent of elected councillors, 12 per cent of elected council leaders, and 10 per cent of local authority chiefs were women. The majority of managers and administrators are men and most women remain in three occupational groups: clerical and secretarial, personal and protective services such as catering, caring, cleaning and selling occupations (Thair and Risden 1999). These occupations are often characterised by part-time work, and poor pay, and are in a mainly narrow range of industrial sectors. Part-time workers are often described as part of the secondary labour market with pay, conditions and employment rights being vastly inferior to those of full-time permanent workers, although legislation now provides for some equalisation.
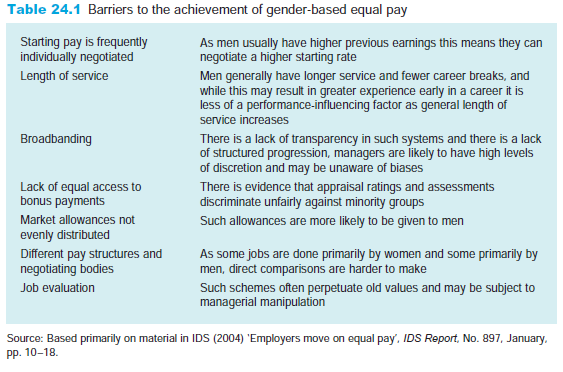
Pay differentials between men and women have narrowed very little except for a hike of women’s pay upwards when the Equal Pay Act 1970 came into force in 1975. According to the Annual Survey of Hours and Earnings 1997-2006 (Dobbs 2007) the mean hourly rate for full-time women is 17.2 per cent lower than that for men, having increased from around 30 per cent lower prior to the Equal Pay Act. However, if overtime is included the current gap widens as men work a greater number of hours. Remembering that around 50 per cent of women work part-time, the same survey shows that the median hourly rate of part-timers (women and men) is 37 per cent less than that for full-timers, with overtime excluded. While some progress has been made towards equal pay and the gap continues to slowly narrow, these factors still remain as barriers to be overcome. The abolition of the wages councils has not helped in this respect, but the minimum wage has provided some limited support. IDS (2004) identifies a range of unintentional consequences of pay systems which prove to be a barrier to achieving equal pay, and these are shown in Table 24.1.
2. Racial and ethnic groups
In spite of the legislation evidence of discrimination continues to exist. The CRE (2006) based on Labour Force Survey data reports that the gap between whites and racial and ethnic minority groups was 15.4 per cent in spring 2005. This picture of comparative level of unemployment has barely changed over the last 18 years, although there has been some improvement since 2003. There are differences between the different ethnic groups. In addition, there is continued segregation in the labour market, with ethnic minority male employees being employed in the hotel, catering and repairs and distribution sectors, and manufacturing industry, to a much greater extent than their white counterparts. But for construction the reverse is true. Segregation also occurs vertically. In the Civil Service for example, the CRE (2006) reports that 3.3 per cent of senior staff were from ethnic minority groups compared with 9.7 per cent of administrative staff, with little change since 2003. Samir Sharma OBE, Chair of the Runnymede Trust, commented that ‘there is still a sea of white faces in the boardrooms of Europe’ (EOR 2000). Racial discrimination may also happen less blatantly. Rana (2003) reports on a project designed to understand why ethnic minority managers are underrepresented in senior levels of local government. The researchers found that in 360-degree feedback results the line managers’ assessments of ethnic minority employees were less favourable for each individual than all other assessments, which were generally similar. This discrepancy
did not occur when considering the ratings of white employees. In terms of pay, nonwhite workers are also comparatively disadvantaged, with ethnic minority male workers as a whole group earning a median of 50p less per hour than white males (CRE 2006). However Indian males earned 41p more per hour than white males, so when treating ethnic minority workers as a group the statistics can hide a wide range of difference.
3. Disabled people
Woodhams and Danieli (2000) point out that people who have a disability face common barriers to full integration into society and yet are a very varied group in that impairments can vary in severity, stability and type. Based on the Labour Force Survey in spring 2005 there are 6.9 million people in the UK who have a current long-term health problem or disability which has a substantial adverse impact on their day-to-day activities and affects the work they can do (ONS 2005). People with a disability are more likely to be unemployed than their able-bodied counterparts, and once unemployed they are likely to remain so for a longer period (EOR 2003). The economic activity rate for disabled people is 55 per cent compared with 84 per cent for non-disabled people, and 50 per cent of disabled people are in employment compared with 80 per cent of nondisabled people (ONS 2005). Hammond (2002) notes that the media have a particularly poor reputation for employing disabled people. This is particularly unfortunate as this is a missed opportunity to create visible and influential role models.
Choice of job is often restricted for people with a disability, and where they do find work it is likely to be in low-paid, less attractive jobs. People with a disability are overrepresented in plant and machine operative jobs and in the personal and protective services, and are underrepresented in professional and managerial jobs (Skills and Enterprise Network 2000). Periods of high general unemployment exacerbate these problems.
Employers traditionally have had a wide range of concerns regarding the employment of disabled people, including worries about general standards of attendance and health, safety at work, eligibility for pension schemes and possible requirements for alterations to premises and equipment. The two ticks disability symbol is a government initiative and can be used by employers to demonstrate their commitment to employing disabled people. Employers who use the symbol make five commitments to action: a guaranteed job interview for disabled applicants, regular consultation with disabled employees, retaining employees if they become disabled during their employment, improving knowledge about disability for key employees, reviewing these commitments and planning ahead. However Dibben et al. (2001) note that the symbol appeared to have only a limited effect on support for disabled employees or potential employees.
4. Age
Due to the Voluntary Code of Practice on Age Discrimination and a range of government campaigns, the awareness of age discrimination has increased. However from its baseline survey (CIPD 2005a) the CIPD reports that age discrimination remained a significant problem, with 59 per cent of respondents reporting that they had been disadvantaged at work due to age, although the number of people, aged 55 and over, who thought they had been passed over for promotion due to age had halved since 1995. And the Department for Work and Pensions (DWP 2006) reports that whilst the employment of older workers has increased over the last 10 years, employment rates still fall with age.
Evidence suggests that line managers have negative perceptions of older workers, seeing them as less able to cope with change, training or technology and less interested in their careers, more likely to be sick and to cost more money to employ. Philpott (2003) reports that in a survey of 600 retired people, two-fifths believe they had suffered discrimination in some way, age discrimination being the most frequent form. He goes on to argue that there are fewer older people in the workforce, not because they prefer to retire, but because they feel they have been discriminated against.
Given that by 2010 almost 40 per cent of the working population will be over 45 (Higginbottom 2002) and the current shortage of many skills, there is a critical problem for organisations. Older workers are also seen to be more loyal and conscientious, to have better interpersonal skills, to be more efficient in the job and their experience in the job counteracts any age-related factors lowering productivity; older workers are generally more satisfied with their jobs and have fewer accidents and a better absence record; and in any case there is considerable variation within individuals. Older workers also have lower turnover rates which saves the organisation money. However CIPD (2005a) found that 68 per cent of workers anticipated going part-time at the end of their careers and yet only 34 per cent of organisations surveyed offered this to all older workers.
On the basis of their research Snape and Redman (2003) argue that discrimination for being too young is at least as common as that for being too old. Both forms of discrimination adversely affected commitment to the organisation, and hence, it could be argued, performance.
Improvements are to be expected due to the pressure of skills and the impact of the Age Discrimination Act 2006, but it is too soon to assess this at the time of writing.
5. Sexuality
Lesbian, gay and bisexual discrimination is the most difficult to identify due to the fact that group membership is more easily concealed, usually due to the anticipation of discrimination. It is therefore difficult to quantify the extent to which these groups experience active discrimination. The protection now given to transsexuals means that they are not forced to offer historical information on their gender, but transsexuals in transition clearly cannot keep this confidential, and will need support and protection from harassment (Higginbottom 2002). Most employers have been slow to include sexual orientation in their diversity management initiatives (Ward 2003).
Wilson (2000) in an article reporting three case studies found that in two of the three organisations sexuality other than the heterosexual norm was not considered acceptable in the culture. In one engineering company, the researcher was told that you would have to be very discreet if you were gay, and that one gay person, who had not ‘come out’, had left the organisation. In the second, a professional partnership, the researcher was told that sexuality was ‘under wraps’. Only in the third, a media organisation, were different sexual orientations considered acceptable.
In a TUC survey carried out at the end of 1998 (EOR 1999b), 44 per cent of the 440 gay, lesbian and bisexual respondents said they had experienced discrimination at work due to their sexuality. Forms of discrimination reported ranged from verbal abuse to dismissal. Even in jobs where employees feel sufficiently comfortable to disclose their sexuality, there is considerable discrimination in the terms and benefits they receive, although legislation is beginning to change this situation.
Some progress has been made: for example Stonewall (Stonewall 2007), which used the Workplace Equality Index for the first time in 2005, found improvements by the time of the 2007 Index.
6. In summary
Although some of the more blatant aspects of discrimination have been significantly improved, there remain considerable discrimination and inequality in respect of minority groups in the workplace. To some extent we are only just beginning to understand the causes and nature of more subtle forms of discrimination which are the root of inequality. We now turn to the theoretical debate which underpins different organisational approaches to tackling discrimination.
Source: Torrington Derek, Hall Laura, Taylor Stephen (2008), Human Resource Management, Ft Pr; 7th edition.
You could certainly see your enthusiasm within the work you write. The arena hopes for more passionate writers such as you who aren’t afraid to mention how they believe. All the time follow your heart.