1. The Graph Editor
With Stata’s Graph Editor, you can change almost anything on your graph; you can add text, lines, arrows, and markers wherever you like.
We will first make a graph to edit and will then point out the tools in the Graph Editor. Start by opening the automobile dataset: sysuse auto. Here is the command that we will use to make the graph:
![]()
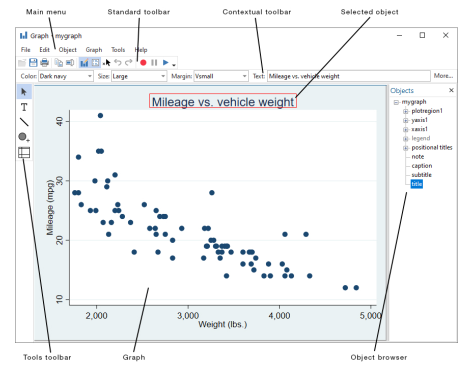
Start the Editor by right-clicking on your graph and selecting Start Graph Editor. Click once on the title of the graph. Here is a picture of the Graph Editor with its elements labeled.
Select any of the tools along the left of the Graph Editor window to edit the graph. The Pointer (Select tool), ![]() , is selected by default.
, is selected by default.
You can change the properties of objects or drag them to new locations by using the Pointer. As you select objects with the Pointer, a Contextual Toolbar will appear just above the graph. In the above example, the title of the graph is selected, so the Contextual Toolbar has controls that are relevant for editing titles. You can use any of the controls on the Contextual Toolbar to immediately change the most important properties of the selected object. Right-click on an object to access more properties and operations. Hold the Shift key when dragging objects to constrain the movement to horizontal or vertical directions.
Add text, lines, or markers (with optional labels) to your graph by using the three Add… tools— T , \ , and ![]() . Lines can be changed to arrows by using the Contextual Toolbar. If you do not like the default properties, simply change their settings in the Contextual Toolbar before adding the text, line, or marker. The new settings will then be applied to all added objects, even in future Stata sessions.
. Lines can be changed to arrows by using the Contextual Toolbar. If you do not like the default properties, simply change their settings in the Contextual Toolbar before adding the text, line, or marker. The new settings will then be applied to all added objects, even in future Stata sessions.
Do not be afraid to try things. If you do not like a result, change it back by using the same tool or by clicking on the Undo button, ![]() , in the Standard Toolbar for the Graph Editor (below the main menu). Edit > Undo in the main menu does the same thing.
, in the Standard Toolbar for the Graph Editor (below the main menu). Edit > Undo in the main menu does the same thing.
Remember to reselect the Pointer tool when you want to drag objects or change their properties.
You can move objects on the graph and have the rest of the objects adjust their position to accommodate the move with the Grid edit tool, ![]() . With this tool, you are repositioning objects in the underlying grid that holds the objects in the graph. Some graphs, for example, by graphs, are composed of nested grids. You can reposition objects only within the grid that contains them; they cannot be moved to other grids.
. With this tool, you are repositioning objects in the underlying grid that holds the objects in the graph. Some graphs, for example, by graphs, are composed of nested grids. You can reposition objects only within the grid that contains them; they cannot be moved to other grids.
You can also select objects in the Object Browser along the right of the graph. This window shows a hierarchical listing of the objects in the graph. Clicking or right-clicking on an object in the Object Browser is the same as clicking or right-clicking on the object in the graph.
The Graph Editor has the ability to record your actions and play them back on later graphs. When you click on the Start recording button,![]() , every editing action you take, including undos and redos, is recorded. If you would like to do some editing that is not recorded, you can click on the
, every editing action you take, including undos and redos, is recorded. If you would like to do some editing that is not recorded, you can click on the
Pause recording button, ![]() . You can click on the Pause recording button again to resume recording. When you are done with your recording, click on the Start recording button. You will be prompted
. You can click on the Pause recording button again to resume recording. When you are done with your recording, click on the Start recording button. You will be prompted
to save your recording. Any recording you save is available from the Play recording button, ► , and may be applied to future graphs. You can even play a recording in any Stata graph command by using the play option. See Graph Recorder in [G-1] Graph Editor for more information.
Stop the editor by selecting File > Stop Graph Editor from the main menu or by clicking on the Graph Editor button. When you stop the Graph Editor, you will be prompted to save your graph if you have made any changes. If you do not save your graph, your changes will not be lost, but you will risk losing them if you create a new graph in the same Graph window. You must stop the Editor if you would like to work on other tasks in Stata.
Here are a few of the things that you can do with the Editor:
- Add annotations using lines, arrows, and text.
- Add or remove grid lines or reference lines.
- Add or modify titles, captions, and notes.
- Change scatterplots to line plots, connected plots, areas, bars, spikes, or drop lines—and, of course, vice versa.
- Change the size, color, margin, and other properties of your graph’s titles (or any other text on the graph).
- Move your legend to another side of the graph, or even place it in the plot region.
- Change the aspect ratio of your graph.
- Stack the bars on a bar graph or turn them into percentages.
- Rotate or change the angle of axis labels.
- Add custom ticks and labels to the axes.
- Change the rule for the number and spacing of ticks and labels on an axis.
- Emphasize a point on the graph, whether marker, bar, spike, or other plot, by making it a custom color, size, or symbol.
- Change the text or properties of a marker label.
Because you can edit every property of every object on the graph, you can change almost anything about your graph. To learn more, see [G-1] Graph Editor or type help graph editor.
Source: STATA (2021), Getting Started with Stata for Windows, Stata Press Publication.
26 Sep 2022
28 Sep 2022
23 Sep 2022
3 Oct 2022
29 Sep 2022
23 Sep 2022