With surveys and other large datasets, we sometimes need frequency distributions of many different variables. Instead of asking for each table separately, for example by typing tabulate tparty, then tabulate obama, and finally tabulate trackus, we could simply use another specialized command, tabl:
. tabl tparty obama trackus
Or, to produce one-way frequency tables for each variable from tparty through trackus in this dataset (the maximum is 30 variables at one time), type
. tabl tparty-obama
Similarly, tab2 creates multiple two-way tables. For example, the following command cross- tabulates every two-way combination of the listed variables:
. tab2 tparty obama trackus
tabl and tab2 offer the same options as tabulate.
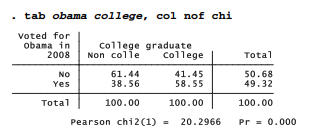
To form multi-way contingency tables, it is possible to use tabulate with a by prefix. For example, here is a simple two-way cross-tabulation of whether the survey respondents voted for Obama in 2008, by whether or not they graduated from college.
One way to make a three-way cross-tabulation of the obama/college relationship by gender is to use sort and the by: prefix. This produces two-way tables with the same layout as above, but separately for males and females.
. sort sex
. by sex: tab obama college, col nof chi
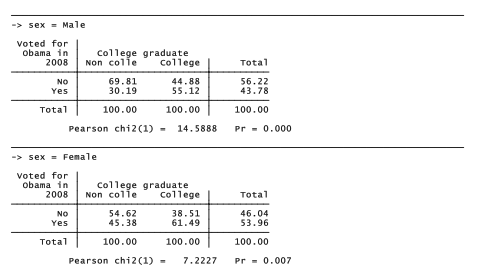
The obama/college relationship is significant and has the same direction in both sub-tables, but appears somewhat stronger among men (where college makes a 25-point difference, 30.19 to 55.12%) than women (a 16-point difference, 45.38 to 61.79%).
This approach can be extended to tabulations of greater complexity. To get a four-way crosstabulation of obama by college, with separate sub-tables for married and unmarried men and women, we could type the commands (results not shown):
. sort sex married
. by sex married: tab obama college, col nof chi
Such multi-way tables divide the data into increasingly small subsamples, where variations become more erratic.
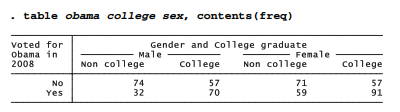
An alternative way to produce multi-way tables, if we do not need percentages or statistical tests, is through Stata’s general table-making command, table. This versatile command has many options, only a few of which are illustrated here. To construct a two-way table of obama by college, with frequencies in each cell, type

If we specify a third categorical variable, it forms the supercolumns of a three-way table:
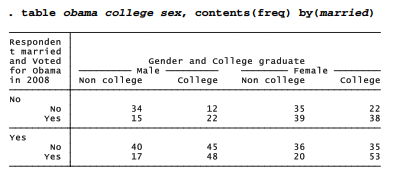
More complicated tables require the by( ) option, which allows up to four supperrow variables. table thus can produce up to seven-way tables: one row, one column, one supercolumn, and up to four superrows. Here is a four-way example:
The table examples above all place frequencies in the cells, but table permits statistical summaries as well. Here is a four-way table, obama x college x sex xmarried, in which each cell contains the mean age for that combination of characteristics. For example, we see that the 34 non-college, unmarried men who did not vote for Obama have a mean age of 46.6 years.

The contents( ) option of table specifies what statistics the table’s cells contain. The choices include not just frequency or mean, but also standard deviation, minimum, maximum, median, range, percentiles and other summaries. Type help table for a full list. The next section illustrates some other possibilities for summary statistics within tables.
Source: Hamilton Lawrence C. (2012), Statistics with STATA: Version 12, Cengage Learning; 8th edition.
29 Sep 2022
26 Sep 2022
23 Sep 2022
3 Oct 2022
30 Sep 2022
26 Sep 2022