After preliminary screening, the next stage of the target market selection model depicted in Figure 7 is a more refined estimate of the market potentials for the candidate generic product in the comparatively small number (say, 15) of prospective target countries.
We define industry market potential as the most probable total sales of a product by all sellers in a designated country over a strategic planning period.7 IMP, then, is total industry sales projected over a lengthy future period, say, three to five years. It is management’s judgment of how big the industry market is now and how it is likely to grow in the future.
Two fundamental approaches may be used by managers to estimate industry market potentials: top-down and bottom-up. The top-down approach can be depicted as follows: IMP = f (X„ X2, . . . , X„), where X! through X„ are a set of predictor variables that have an established relationship to industry sales. A common technique to determine those relationships is a regression analysis of historical data. As we have seen, this approach is well suited to preliminary screening where economic/social statistics are used as predictor variables (indicators). It is also well suited to making IMP estimates for consumer products that are sold to very large numbers of final buyers. To illustrate, one might estimate the IMP for television sets by using the following predictor variables: number of households, percentage of population literate, pertentage of population living in urban areas, percentage of population in nonagricultural activities, per- capita income, index of standard of living, price per unit, and price per unit/per-capita income. The coefficients of these variables could be obtained from a regression analysis of historical sales of television sets.
The bottom-up approach can be expressed as follows: IMP = SjQj + S1Q2 + . . . + S„Q„, where S represents the number of final users in each segment comprising the total industry market and Q represents the average quantity of the candidate product type purchased by users in each segment. If actual purchase data are available for these segments, then IMP may be estimated with time series analysis. Other sources of estimation include surveys of buyer intentions and expert opinion. Since purchase data are rarely available and buyer surveys and expert opinion polls are likely to be costly and time-consuming when many countries are being investigated, it is usually desirable for managers to estimate the Q values indirectly by relating sales to some characteristic of the actual or potential users making up each segment. Conceptually, this involves a reformulation of the preceding equation: IMP = at U, + a2U2 + … + anU„, where the U variables represent the output, employment, or other characteristic of the different user groups (market segments) and the a variables represent the use coefficients that relate the amount of product used to the U variables. Thus ax might represent the amount of component materials, the number of component parts, or the amount of operating supplies per unit of output, and Uu the output (actual or potential) of users in that segment.
The bottom-up approach is best suited to industrial products or, more generally, products that have a limited number of identifiable end users. It requires managers to (1) identify the actual and potential uses of the candidate product (the basis of the consumer/user profile), (2) identify the actual and potential users (.S’| through S„) for each use in the prospective target country, and (3) estimate the actual and potential use of the product by each user segment. The latter requires information on industrial category, size, output, and other characteristics of user firms, on the current use of substitute products, on the ability of firms to buy the candidate product, and on other factors that influence purchase decisions.
The top-down and bottom-up approaches are complementary. Whenever feasible, managers should use both. Divergent top-down and bottom- up estimates call for a reconsideration of both estimates; convergent estimates justify confidence in their accuracy.
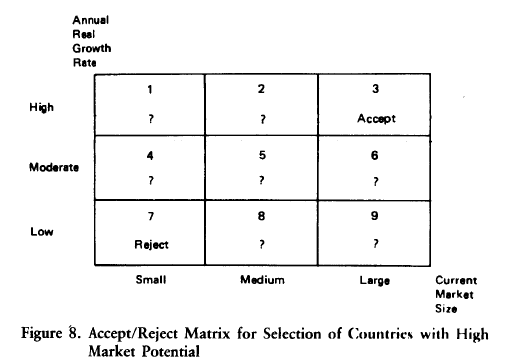
Managers are concerned with two dimensions of an industry market potential: (1) the absolute size of the current market, and (2) the projected growth of the market over the strategic planning period. The accept/reject decision, therefore, involves a trade-off between size and growth. This trade-off is illustrated by the nine-cell matrix in Figure 8.
In practice, company managers would assign specific percentages to the three growth categories in Figure 8 and specific dollar or quantity amounts to the three size categories. If a country were to fall in cell 3, it would be clearly acceptable as a high-market-potential country, because it offers a large, high-growth market. Conversely, if a country were to fall in cell 7, it would be clearly unacceptable as a high-market-potential country. But what about countries falling in the other cells? The accept/reject designation of these cells would depend on the growth/size trade-off established by company managers, a conditionality indicated by question marks. If, for exam-pie, large market size were deemed very important, then managers might accept a country falling in cell 9, despite its low growth. On the other hand, if high growth were deemed critical, managers would reject a country falling in cell 9 but accept a country falling in cell 1, despite its small market size. In short, there are no absolute accept/reject standards; the accept/reject rule is itself a management decision. Whatever the rule used by managers, we assume in this exposition that certain countries are accepted as high-market-potential countries (say, 5 in number). The next stage in the selection of a foreign target market is to estimate the sales potentials for the company’s own product in those countries.
Source: Root Franklin R. (1998), Entry Strategies for International Markets, Jossey-Bass; 2nd edition.
Only wanna comment that you have a very nice website , I love the pattern it actually stands out.