Different analysts develop different methods for screening for favorable stocks. Let’s look at ways a few selected professionals go about this task.
1. William O’Neil CANSLIM Method
CANSLIM is an acronym for a method of picking stocks to buy, devised by William O’Neil (2002), publisher of Investor’s Business Daily. The data and ratings for each stock are included in a subscription to that newspaper. The breakdown of CANSLIM is as follows:
C—Current quarterly earnings per share versus a year earlier
A—Annual earnings increases
N—New products, management, and stock price highs
S—Supply and demand of stock
L—Leader or laggard
I—Institutional sponsorship
M—Market direction
We, as technical analysts, are only concerned with L and M. The other selection criteria are useful but not in the domain of this book. To determine L, leader or laggard, O’Neil calculates the 12-month percentage price change of every stock, weighted more heavily over the most recent 3 months, and ranks each stock in percentiles from 99 to 0, with 99 being the strongest. He has not divulged the exact formula, but as we know from academic studies and others, the exact calculation is less important than the lookback time over which price change is measured. This method is on the long side at 12 months, about the time when a strong stock begins to revert to its moving average. The weighting over the past 3 months reduces the overall time for comparison and, therefore, improves the prospects of price strength continuing. O’Neil found that the average relative strength percentile, by his calculation, was 87 before large upward moves.
For M, market direction, O’Neil refuses to listen to newsletters and “gurus” and refuses to use economic data because it lags behind the market. He has a number of specific indicators and patterns he watches for signs that a market is bottoming. He believes that the buy-and-hold method is faulty because the widely held belief that all stocks will recover after a bear market is a myth.
2. James P. O’Shaughnessy Method
Not surprisingly, James O’Shaughnessy, the president of O’Shaughnessy Capital Management in Greenwich, Connecticut, found in studying 43 years of fundamental and price data that most investment strategies are mediocre at best and that traditional investment management does not work. He studied market capitalization, price-to-earnings ratios, price-to-book ratios, price-to-cash flow ratios, price-to-sales ratios, dividend yields, earnings changes, profit margins, and return on equity. He found that relative price strength, out of all the possible variables, fundamental and technical, was the only “growth variable that consistently beats the market” (1997).
O’Shaughnessy’s calculation of relative strength is similar to O’Neil’s in that it takes a ratio of the year-end price to the price one year prior. It is, thus, a 12-month relative price strength measure, a slightly longer-term calculation considering the history of relatively strong stocks remaining strong. O’Shaughnessy developed from his testing of data from December 31, 1954, through December 31, 1995, a multifactor investment strategy model called the Cornerstone Growth Strategy. It includes a primary screen for stocks with a price-to-sales ratio below 1.5, earnings greater than the previous year, and of those selected so far, the top 50 stocks in relative price strength.
3. Charles D. Kirkpatrick Method
Charles Kirkpatrick (2001), coauthor of this book, has long had a model similar to that of O’Shaughnessy. The principal differences are twofold. First, in working with Robert Levy in the late 1960s, he discovered the importance of relating all ratios to each other. Thus, in using the stock price, he calculates the ratio of the closing price to the stock’s moving average and then ranks all stocks by their ratio. Second, Kirkpatrick uses the Levy calculation of relative price strength over six months in line with Levy’s original work and that of later studies showing the importance of that period for postcalculation continuation of price strength (see Figure 21.11).
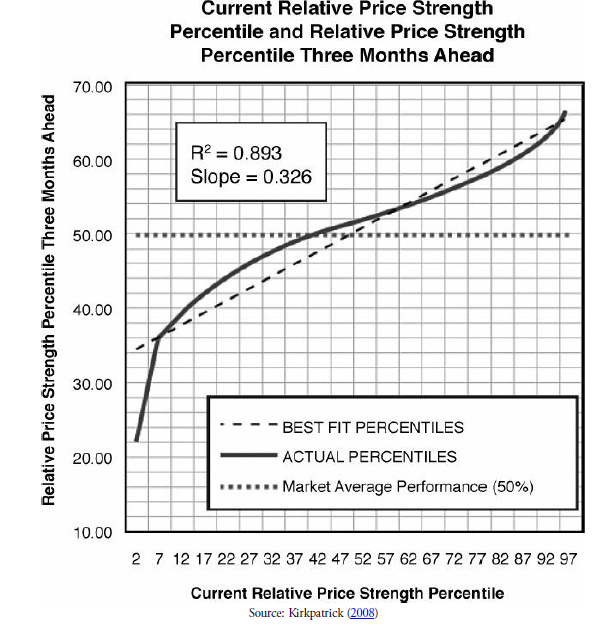
FIGURE 21.11 Relative three-month performance of stocks selected by relative price strength using the Kirkpatrick (2008) method
Figure 21.11 is a chart of the relationship between the current relative price strength percentile (independent variable) and relative price strength percentile three months later (dependent variable). The relationship is strong. The dark, straight line (actual data) fits closely to the dark, dashed line (expected data) and has a relatively steep slope of 0.326. This suggests that for every increased point in relative price strength percentile, the results increased by close to a third of a point. Its R2 is high at 0.893, suggesting that the relationship is relatively close to perfect, which would be 1.000. It is positive, which suggests the higher the current relative price strength percentile, the higher will be the relative price strength percentile three months later. The best three-month performance comes from the highest level of current relative price strength percentile.
4. Value Line Method
The Value Line Ranking System (www.valueline.com) has an extraordinary history of outperforming the stock market. Value Line claims that its Timeliness Ranking system has outperformed the Standard & Poor’s 500 by 16 to 1 since 1965. Although the company will not divulge its method of calculation, it does admit that a significant portion of it includes a calculation of relative price strength. Other factors include earnings trends, recent earnings, and earnings surprises. Value Line charges a fee for its stock services.
5. Richard D. Wyckoff Method
A method of profiting from the stock market using technical analysis and relative price strength that has stood the test of more than 80 years is the method that has been taught by Richard DeMille Wyckoff since 1931.
Richard Wyckoff, now considered a legend and one of the most important proponents of technical analysis, began his long career in Wall Street as a runner in 1888 when he was only 15 years old. He organized his own brokerage firm by the time he was 25. From his brokerage firm, he published a daily newsletter that evolved into a magazine called the Magazine of Wall Street. Motivated by seeing “appalling losses in securities suffered annually by millions of people who do not realize what they are risking and have an amazingly small knowledge of the market” (Hutson, 1986), in 1910, under the pen name “Rollo Tape,” Wyckoff described many important aspects of the stock market in a book titled Studies in Tape Reading. His observations then are still valid today. Before retiring for health reasons in 1928, his subscriber list exceeded 200,000 names, and later, when he returned to Wall Street in the early 1930s, he wrote many books on the subject of profiting from the stock market and developed a correspondence course.
Wyckoff believed most strongly that stock prices were determined solely by “supply and demand.” He had little use for “tips, rumors, news items, earnings analyses, financial reports, dividend rates, and the myriad of other sources of information” or the “half-baked trading theories expounded in boardrooms and popular books on the stock market” (Wyckoff in Hutson, 1986). He was a true technical analyst, and a successful one. He believed that the markets were influenced mostly by wealthy individuals and informed insiders. Substituting “institutions” today for these players, we find that the situation has not changed. By understanding what these capital pools were doing in the markets, one could profit by following them. Their capital moved the markets, right or wrong, and the small investor could take advantage of this movement by understanding how to gauge it.
Wyckoff s tools were many of the methods described in this book. He used bar charts (called vertical charts) and point and figure charts (called figure charts). He measured relative strength for both long and short positions, used volume as a means of testing the best time to consider acting, required stop orders be entered with any action order, used trend lines to determine direction, used composite indexes, used group indexes, and believed that timing of entry and exit was the most important variable in success. Support and resistance, reversal points (called danger points), and horizontal counts from figure charts were important to his method. In short, he used about everything you have learned so far. He believed that attempting to fit the market into a formula or specific pattern was futile because no two markets are the same. The market, he believed, traveled in waves—small ones evolving into larger ones in either direction. He believed that these waves could be detected and even anticipated, but they followed no certain, mathematical path. Consequently, although his method had some organization, it required judgment and experience.
Wyckoff s progression of selecting stocks was as follows:
- To determine the direction of the entire market, Wyckoff devised an index called the Wyckoff Wave that was a composite of the most widely held and active stocks. This was his proxy for the market. Preferably, the stocks in the index were the ones that the investor or trader was interested in trading. His concept of trend was to watch trend lines drawn on the Wave chart and on charts of the composite market.
- To select the stocks in harmony with the market, Wyckoff selected stocks that were strong in upward trends and weak in downward trends. He believed it was futile to act against the trend. His calculation of relative price strength used the percentage changes from wave highs to lows and lows to highs of each stock versus those of the Wyckoff Waves. Those stocks that consistently outperformed in each wave in the direction of the longer wave trend were the ones to analyze further.
- To determine the potential of those selected so far, Wyckoff used the point and figure horizontal count. At the same time, a stop level was established, and for the stock to be considered further, a three-to-one ratio of potential gain to potential stop loss was necessary.
- To determine if the stock is ready to move, shorter-term considerations were needed to analyze the nature of its price action. To do this, Wyckoff relied on volume, range, and to some extent, short-term momentum. This portion of his method relied heavily on experience and judgment.
- To time the entry, Wyckoff based his decision on the turning in the overall market. His basis for this principle was that most stocks move with the market direction, and timing with the market change reduces the risk of error.
Source: Kirkpatrick II Charles D., Dahlquist Julie R. (2015), Technical Analysis: The Complete Resource for Financial Market Technicians, FT Press; 3rd edition.
I couldn’t resist commenting