At present, almost 8,000 stocks trade in the active stock markets in the United States. This number is too large for an analyst to screen at frequent intervals. Some technical analysts briefly inspect the chart of every stock in their universe, using a bar, candlestick, or point and figure chart. This is a laborious process that’s far from objective. Others screen through relative strength ratio charts. The least time-consuming and most objective method is to screen all stocks on a periodic basis for relative price strength using one of the methods described next. Relative strength provides evidence that a particular stock is outperforming the market and is likely in a strong, upward trend. These methods have also been used successfully in mutual funds, ETFs, industry group selection, commodities, and foreign securities.
1. Relative Strength
Most technical screening methods use a concept called relative strength to judge which securities have the most promise. Relative strength is a reliable concept that has been demonstrated academically and practically to have value. Indeed, because the method is so successful, it is the primary argument against the Random Walk and Efficient Markets Hypotheses. The presumption behind the concept of relative strength is that strength will continue, similar to the way trends will continue, and that by recognizing the strongest trends, an edge can be obtained by investing in them until their strength abates. If the strongest stocks remain strong, the market cannot be random or efficient.
The most common means of establishing relative strength is called the ratio method. It is merely the ratio between two investments, sectors, industry groups, averages, commodities, and so on to see which is outperforming the other. Usually a line chart is drawn that shows the item of interest, say a steel stock, and a ratio of the item to an average, say a steel industry average. If the line of the ratio is rising, it is simply showing that the particular stock is stronger than its industry average. Interpretations of behavior are similar to those used in price and other oscillators. Divergence analysis, trend lines, and even patterns appear in the ratio lines. The item can also be plotted in a point and figure chart along with a point and figure chart of the ratio similar to what is shown in the sector charts shown in Figures 21.8 and 21.9.
2. Academic Studies of Relative Strength
In 1967, Robert Levy, PhD, published a paper in the Journal of Finance in which he argued that relative price strength tended to remain for a long-enough period that it could be profitable and that the concept of random walk was, therefore, dead. His paper received considerable opposition at that time when the Efficient Markets Hypothesis (EMH) and the Random Walk Hypothesis (RWH) were relatively new and highly favored among academics.
Not until 1993 was another major paper published on the subject of relative price strength, or momentum as it is commonly called. This paper, “Returns to Buying Winners and Selling Losers: Implications for Stock Market Efficiency,” was also published in the Journal of Finance. The authors, Professors Narishimhan Jegadeesh and Sheridan Titman, demonstrated how stocks with high returns over a 3- to 12-month period earned excess profits of about 1% per month for the following year. However, they also found that these stocks on average had losses 13-60 months later, thus proposing the theory that relative price strength was not permanent but more likely a temporary phenomenon. They clearly stated that the t-test statistical evidence forced them “to conclude that the hypothesis of market efficiency can be rejected at even the most conservative levels of significance.”
In a study of 150 momentum (relative strength) and contrarian strategies, Conrad and Kaul (1998) also found that the optimum profit occurred during the 3- to 12-month horizon. In addition, they found that a contrarian strategy (buying the lows) only had statistically significant profits during the period 1926-1947.
Of course, other academics immediately criticized the study for any number of possible reasons, but by the time of Conrad and Kaul’s paper, other doubts about market efficiency had also been demonstrated, and the evidence was not rejected immediately as it had been with Levy in the 1960s. Since then, the basis of their paper has been proven correct not only in foreign countries but also in the period following the original paper in the United States, as reported in a subsequent paper by Jegadeesh and Titman in 2001 in the Journal of Finance.
In 1998, Professor K. G. Rouwenhorst showed that momentum was successful in 12 European stock markets, and in 1999, he demonstrated that momentum was most strong in emerging markets. Other studies confirm the existence of profitability from relative strength in China, Germany, eight different Asian markets (without Japan), and Switzerland. Even Professor Eugene Fama, one of the originators of the EMH, found that momentum was the only anomaly to survive a multitude of tests (Fama and French, 1996). Academia has, thus, concluded that the theory of relative price strength shows success not only in producing profits but also in debunking part of the EMH.
Various reasons have been proposed for the existence of relative strength, none of which has been proven. The most logical has to do with behavioral tendencies of investors and the flow of information. An excellent discussion of the behavioral model describing investor underreaction and overreaction is Barberis, Shleifer, and Vishny (1997). However, we are not concerned with why relative strength is valid. Our only concern is that over a period of three to six months, using relative strength is a viable strategy and is, thus, a reliable means of selecting stocks.
3. Measuring Relative Strength
Given the importance of relative strength, the technical analyst needs a method for measuring it. A number of methods of measuring relative strength exist, the most popular being the percentage change, the alpha, the trend slope, and the Levy methods.
4. Percentage Change Method
In their study, Jegadeesh and Titman used a six-month price change as their basic lookback calculation. Lookback is the period over which relative price strength is calculated. The stocks then were sorted based on these rates of change. They found that the higher decile stocks continued to be strong for the next three to ten months. Their sample included both large capitalized and thinly capitalized and both high-priced and low- priced stocks. All performed similarly both in the original experiment and in the subsequent out-of-sample tests.
Box 21.2 Calculation of Alpha for AAPL
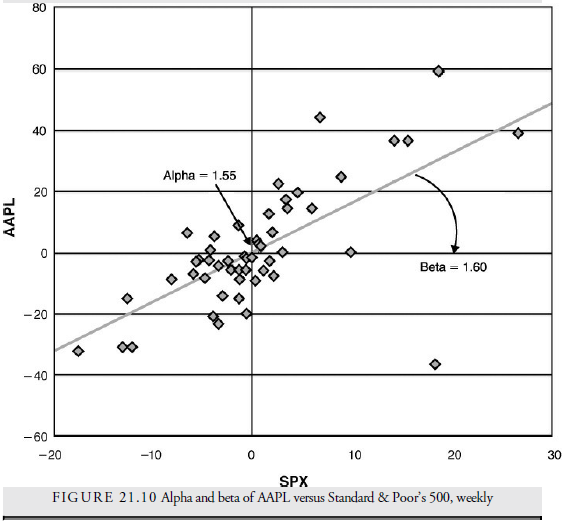
The graph in Figure 21.10 shows the scatter plot of weekly changes in AAPL (Apple Computer stock) and the S&P 500 index. The linear regression line through the scatter plot can be defined by its beta (1.60) and its alpha (1.55). Beta represents how volatile AAPL is relative to the S&P. AAPL’s beta of 1.6 implies that AAPL stock will, on average, move 60% more than the S&P 500 on a weekly basis. The alpha of 1.55 indicates that AAPL has been outperforming the S&P by 1.55% on average over the 52 weeks in the plot. It thus has a positive alpha and is a strong stock. Comparing AAPL’s alpha to that of other stocks is a way to determine the strongest and best candidates for investment. For a more thorough explanation of linear regression, see Appendix A, “Basic Statistics.”
5. Alpha Method
A number of different methods of calculating relative strength have been developed. One is the alpha method. In the beta theory of Modern Portfolio Theory (MPT), stock prices are compared with an average, usually the S&P 500, weekly, over a year (and sometimes with different time intervals and period). The weekly percentage change in the stock price is plotted versus the weekly percentage change in S&P 500, and a linear regression line is drawn through these plots on a best-fit basis. The line so defined is expressed using the slope of the line, called the beta, and the intercept with the vertical axis, called the alpha. Thus, each stock over a specified period has an alpha and a beta. Traditionally, beta has been used as a measure of volatility relative to the S&P 500 and considered a definition of market risk. Stocks that have a steep slope in their regression line and have a high beta demonstrate a proclivity to have higher gains than the S&P 500 when the market is higher but, also, larger losses than the S&P 500 when the market is lower. The alpha describes the value when the regression line crosses the 0% change in the S&P and is, thus, a measure of the trend relative to the S&P 500. MPT suggested that high beta stocks would be more profitable but would also be more risky. What they missed is that high beta stocks could also have negative alphas, suggesting that, although more volatile, their trends relative to the S&P could be downward. In MPT, the alpha must always either approach or be close to zero because, in theory, no systemic gain can come from the market (the S&P 500) itself. In other words, a stock’s price motion is determined by beta, not alpha. Alpha is not considered of any importance. However, in actual markets, alpha does not remain at the zero level and has, thus, become a measure of how much better or worse the stock is performing relative to the S&P. When alpha is compared among stocks, it provides a relative strength measure, and stock lists can be ranked by alpha to show which issues are the strongest. Alpha will change more frequently and more widely than beta, but beta is somewhat irrelevant to the relative price strength and has been largely discarded, even as a measure of volatility.
6. Trend Slope Method
Rather than go through the more complicated calculation of alpha and beta, another method of screening for relative price strength is to calculate the slope of the price curve in percentage terms over a specified period through a linear regression formula for each stock. The stocks can then be ranked by the slopes of their price curves. This method is similar to the alpha method and to the Jegadeesh and Titman method. It is easier to calculate than the alpha method and does not suffer from the drop-off effect of a rate-of-change calculation beginning at an arbitrary price.
7. Levy Method
Robert Levy introduced a method of calculating relative strength in his 1965 paper. Levy first calculated the ratio of the stock’s current price to its 131 trading-day moving average. He then ranked this ratio against the same ratio for all other stocks.
Levy found, as did Jegadeesh and Titman later, that the screen for relative strength should be calculated on performance of the stock over a six-month lookback period. Anything shorter tended to give multiple whipsaws in postcalculation performance, and anything longer tended to be too close to when the performance began to regress back to its mean. Levy also found that when the overall stock market headed downward into a lengthy bear market, relative strength continued to be reliable but gradually lost its ability to pick winning stocks, and when the final decline, the washout, occurred, those stocks having been relatively the strongest usually declined the most. In his estimation, relative strength was, thus, a bull market selection process and should not be used when the stock market declines.
One of the authors has tested the method live over 17 years (Kirkpatrick, 2001) using 26 weeks as the lookback period. He found it still provides a consistent list of winning stocks. Twenty-six weeks is close enough to Levy’s original 131 days and can be substituted in the ratio to make the calculation easier.
Source: Kirkpatrick II Charles D., Dahlquist Julie R. (2015), Technical Analysis: The Complete Resource for Financial Market Technicians, FT Press; 3rd edition.
Can I just say what a relief to find someone who actually knows what theyre talking about on the internet. You definitely know how to bring an issue to light and make it important. More people need to read this and understand this side of the story. I cant believe youre not more popular because you definitely have the gift.
I want studying and I believe this website got some truly useful stuff on it! .