The concept of trend is central to the field of technical analysis. Therefore, analysts have developed a number of applications and variations of trend lines. Trend lines are not just useful with bar charts; analysts using point and figure charts make use of trend lines. Speed lines, Andrews Pitchfork, and Gann fan lines are all example of types of trend lines that technical analysts use.
1. Trend Lines on Point and Figure Charts
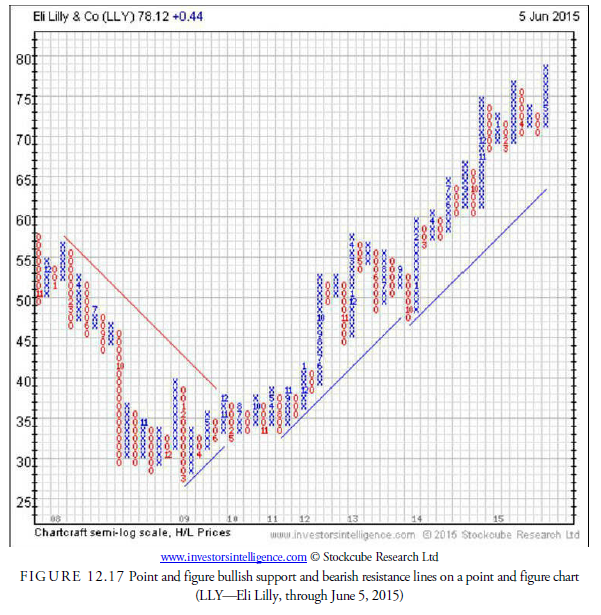
A trend line may be drawn between successive lows or highs in the standard, old-style, point and figure charts, just as they are drawn in a bar or candlestick chart. There is one variation, however, that occurs in the three-box reversal method. For this type of chart, trend lines are drawn at 45-degree angles (see Figure 12.17). Upward trend lines, called bullish support lines, are drawn at a 45-degree angle from the lowest low, and downward trend lines, called bearish resistance lines, are drawn from the last peak. These lines are not really trend lines in the sense that we have covered earlier, but price penetration through them has a specific meaning. We cover these in more detail in Chapter 16, “Point and Figure Chart Patterns.”
2. Speed Lines
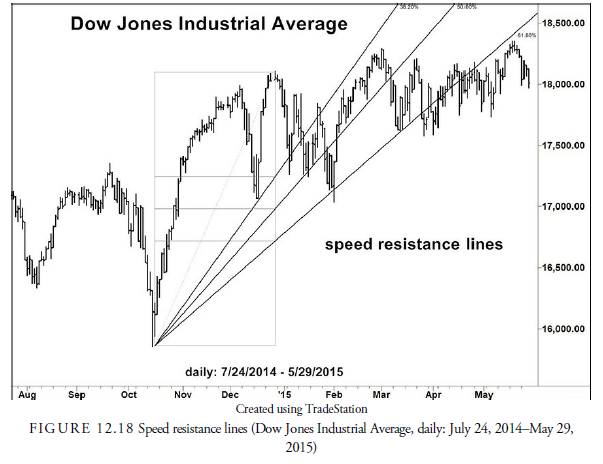
The late Edson Gould, an early proponent of technical analysis who did extensive market research, developed a means of estimating future support and resistance by what he called speed lines. Speed lines are calculated in the instance of an uptrend by taking the low point of the advance and the high point and creating a box whereby the low point is the lower-left corner and the high point is the upper-right corner (see Figure 12.18). Alternatively, during a downtrend, the beginning of the decline (the high point) is the upper-left corner of the box and the low point is the lower-right corner of the box. The vertical line from the high to the low straight down from the high is then marked at each third and at the halfway level, and a “speed” line is drawn from the actual low in the lower-left corner through each of the two marks on the right side and projected into the future. His hypothesis was that these speed lines were natural levels of support, and the prices would retrace to them. Modern methods have included marking the Fibonacci ratio numbers of 38.2% and 61.8% and drawing the speed lines through them. Because retracements do not seem to follow a consistent percentage, it seems doubtful that much merit should be applied to speed lines, but they are often seen in the literature on technical analysis.
3. Andrews Pitchfork
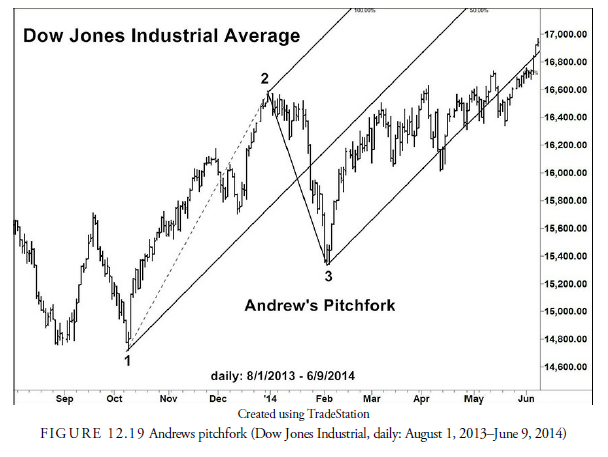
Developed by Dr. Alan Andrews, the pitchfork, in a downtrend (see Figure 12.19), takes the earliest high (1), the next minor low (2), and the first major retracement high (3) and then draws a line between the low and the retracement high (2-3). It then marks the halfway point on that line, draws a trend line through the earlier high and that mark, extending it into the future, and draws parallel lines to that new line from the minor low and from the retracement high. It sounds complicated, and like the speed line, apparently has limited value in projecting future support and resistance levels. Users claim that 80% of the time after the pitchfork is formed, prices will retrace to the middle line (1 – A). This has not been tested, however. The method is often seen in press articles, likely because of the name (similar to candlestick patterns that also have catchy names), but its usefulness is suspect.
4. Gann Fan Lines
William Delbert Gann, known as W. D. Gann, was a famous commodities trader and book writer on trading tactics. He developed a number of technical methods (see Chapter 20, “Elliott, Fibonacci, and Gann”) that are still used by some practitioners. His invention of fan lines came from his belief that prices and time were related in a geometric pattern. To construct these lines, he used nine basic angles of trend lines based on the simple arithmetic relationship between the numbers 1, 2, 3, 4, and 8. By relating these numbers to a theoretical triangle beginning at an important price turning point, he could draw a series of trend lines that he thought had meaning. The angle of the trend line was always a ratio of the numbers converted into degrees. For example, he believed that 1 by 1 was the most basic ratio and converted into 45 degrees. From there to 1 by 2 was 63.75 degrees; 1 by 3 was 71.25 degrees, and so forth. Figure 12.20 shows the Gann fan lines drawn on the Dow Jones Industrial Average daily chart used earlier for the Andrew’s pitchfork. There is little statistical support for any of these methods, and you can see that the lines are similar regardless of the method used. There appears to be no foolproof method of anticipating trend lines. The best method is still to draw a line through the actual price data.

Source: Kirkpatrick II Charles D., Dahlquist Julie R. (2015), Technical Analysis: The Complete Resource for Financial Market Technicians, FT Press; 3rd edition.
8 Jul 2021
7 Jul 2021
7 Jul 2021
6 Jul 2021
7 Jul 2021
6 Jul 2021