Just as buyers of inputs can have monopsony power, sellers of inputs can have monopoly power. In the extreme, the seller of an input may be a monopolist, as when a firm has a patent to produce a computer chip that no other firm can duplicate. Because the most important example of monopoly power in factor markets involves labor unions, we will concentrate most of our attention there. In the subsections that follow, we show how a labor union, which is a monopolist in the sale of labor services, might increase the well-being of its members and substantially affect nonunionized workers.
1. Monopoly Power over the Wage Rate
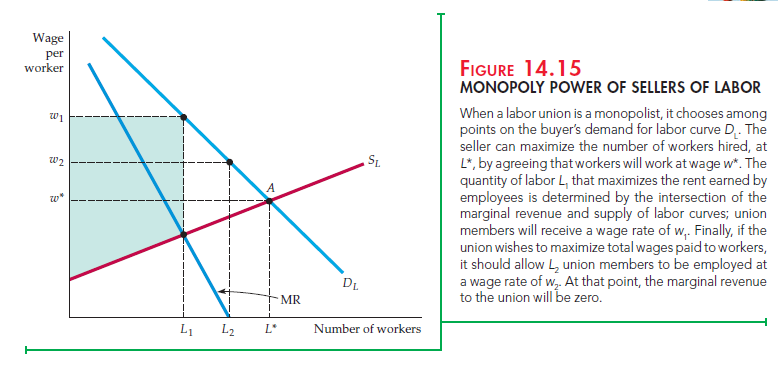
Figure 14.15 shows a demand for labor curve in a market with no monopsony power: It aggregates the marginal revenue products of firms that compete to buy labor. The labor supply curve describes how union members would supply labor if the union exerted no monopoly power. In that case, the labor market would be competitive, and L* workers would be hired at a wage of w*, where demand DL equals supply SL.
Because of its monopoly power, however, the union can choose any wage rate and the corresponding quantity of labor supplied, just as a monopolist seller of output chooses price and the corresponding quantity of output. If the union wanted to maximize the number of workers hired, it would choose the competitive outcome at A. However, if the union wished to obtain a higher-than- competitive wage, it could restrict its membership to L1 workers. As a result, the firm would pay a wage rate of w1. Although union members who work would be better off, those who cannot find jobs would be worse off.
Is a policy of restrictive union membership worthwhile? If the union wishes to maximize the economic rent that its workers receive, the answer is yes. By restricting membership, the union would be acting like a monopolist, which restricts output in order to maximize profit. To a firm, profit is the revenue that it receives less its opportunity costs. To a union, rent represents the wages that its members earn as a group in excess of their opportunity cost. To maximize rent, the union must choose the number of workers hired so that the marginal revenue to the union (the additional wages earned) is equal to the extra cost of inducing workers to work. This cost is a marginal opportunity cost because it is a measure of what an employer has to offer an additional worker to get him or her to work for the firm. However, the wage that is necessary to encourage additional workers to take jobs is given by the supply of labor curve SL.
The rent-maximizing combination of wage rate and number of workers is given by the intersection of the MR and SL curves. We have chosen the wage-employment combination of w1 and L1 with the rent-maximization premise in mind. The shaded area below the demand for labor curve, above the supply of labor curve and to the left of L1, represents the economic rent that all workers receive.
A rent-maximizing policy might benefit nonunion workers if they can find nonunion jobs. However, if these jobs are not available, rent maximization could create too sharp a distinction between winners and losers. An alternative objective is to maximize the aggregate wages that all union members receive. Look again at the example in Figure 14.15. To achieve this goal, the number of workers hired is increased from L1 until the marginal revenue to the union is equal to zero. Because any further employment decreases total wage payments, aggregate wages are maximized when the wage is equal to w2 and the number of workers is equal to L2.
2. Unionized and Nonunionized Workers
When the union uses its monopoly power to increase members’ wages, fewer unionized workers are hired. Because these workers either move to the nonunion sector or choose initially not to join the union, it is important to understand what happens in the nonunionized part of the economy.
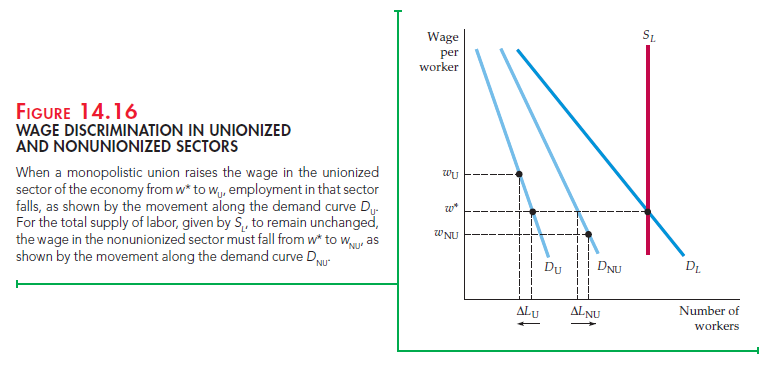
Assume that the total supply of unionized and nonunionized workers is fixed. In Figure 14.16, the market supply of labor in both sectors is given by SL. The demand for labor by firms in the unionized sector is given by D , the demand in the nonunionized sector by DNU. Total market demand is the horizontal sum of the demands in the two sectors and is given by D.
Suppose the union chooses to increase the wage rate of its workers above the competitive wage w*, to wU. At that wage rate, the number of workers hired in the unionized sector falls by an amount ALU, as shown on the horizontal axis. As these workers find employment in the nonunionized sector, the wage rate in that sector adjusts until the labor market is in equilibrium. At the new wage rate in the nonunionized sector, wNU, the additional number of workers hired in that sector, A LNU, is equal to the number of workers who left the unionized sector.
Figure 14.16 shows an adverse consequence of a union strategy directed toward raising union wages: Nonunionized wages fall. Unionization can improve working conditions and provide useful information to workers and management. But when the demand for labor is not perfectly inelastic, union workers are helped at the expense of nonunion workers.
Source: Pindyck Robert, Rubinfeld Daniel (2012), Microeconomics, Pearson, 8th edition.
17 Apr 2021
20 Apr 2021
26 Apr 2021
26 Apr 2021
15 Apr 2021
20 Apr 2021