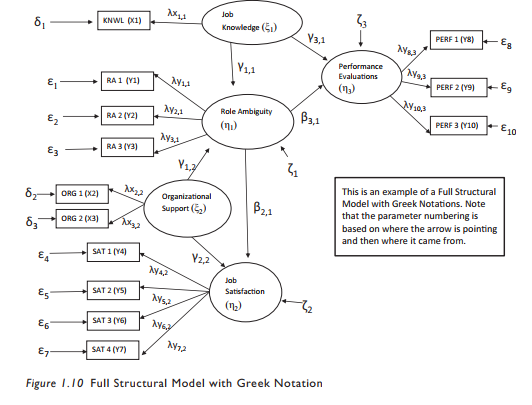
Many SEM programs produce their results using Greek notations. They use Greek letters to represent different constructs and relationships. AMOS does not produce output using Greek notations, but you need to be familiar with them so you can understand the results from other SEM programs.
What Do All These Greek Symbols Mean?
Latent Constructs
ξ (Ksi) Represents an independent latent variable
η (Eta) Represents a dependent latent variable
Item Measures
X Indicator measures associated with independent latent constructs
Y Indicator measures associated with dependent latent constructs
Structural Relationships
γ (Gamma) Parameters representing regression relationships from independent latent con- structs to dependent latent constructs
β (Beta) Parameters representing regression relationships from dependent latent con- structs to dependent latent constructs
Error Terms
ζ (Zeta) Error term for a latent dependent construct
ε (Epsilon) Measurement error terms associated withY item measures
δ (Delta) Measurement error terms associated with X item measures
Measurement Relationships
λ (Lambda) Is the relationship from the latent construct to its indicators. Lambda repre- sents the relationship to X and Y indicators from a latent construct.
Covariances
φ (Phi) Represents covariances between latent constructs
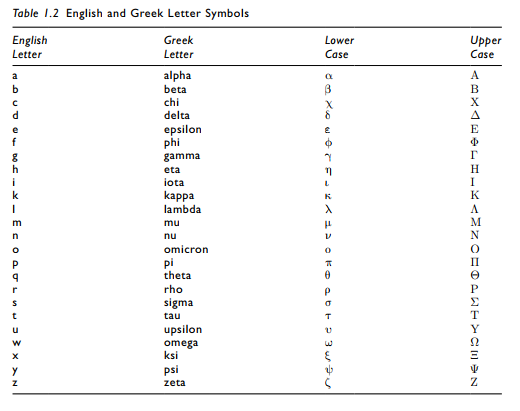
Table 1.2 contains a list of English and Greek letter symbols for your reference.
Highlights of the Chapter
- Structural equation modeling (SEM) is a family of statistical techniques that examine the measurement properties of a variable along with the interrelationships between variables.
- The advantage of SEM over other techniques is that it can assess multiple dependent vari- ables at once and also account for measurement error in each variables.
- The covariance matrix is the primary input for SEM in AMOS, though the correlation matrix can be used.The covariance matrix will primarily determine directionality where correlations determine strength.
- SEM is often called “causal” modeling, but correlations alone do not determine causation. Causation is often determined through a manipulation group and control group to see if differences exit.
- With any SEM model, theory should lead model conceptualization and justification for proposed relationships.
- SEM uses diagrams to denote The symbols used in these diagrams are:
- Unobserved variables are circles
- Observed variables are boxes
- Path relationships are single headed arrows
- Error terms are represented by a circle and a one way arrow
- Covariances between variables are double headed arrows
- Independent variables, also known as exogenous variables, will influence dependent vari- ables, also known as endogenous variables
- It is preferred to measure unobservable constructs with multiple indicators. Measur- ing an unobservable construct with a single indicator is problematic because you cannot determine measurement error in the indicator.
- A measurement model examines the relationships from the constructs to their indica- tors. A structural model examines the relationships between constructs. A full structural model examines the relationships between constructs while also including the measure- ment model properties of each construct.
Source: Thakkar, J.J. (2020). “Procedural Steps in Structural Equation Modelling”. In: Structural Equation Modelling. Studies in Systems, Decision and Control, vol 285. Springer, Singapore.
28 Mar 2023
31 Mar 2023
27 Mar 2023
28 Mar 2023
31 Mar 2023
28 Mar 2023