A stop order is an order to buy or sell once a specific price has been surpassed. For example, a buy stop would be an order to buy a security at a specified price above the current price. Should the price rise to the specified buy stop price, it will be bought at the market. Conversely, a sell stop is an order to sell a security at a specified price below the current price when reached. The stop order can be further refined by adding a limit such that once the stop is triggered, the order becomes a limit order.
1. What Are Entry and Exit Stops?
Stop orders, also called “stops,” can be used to enter a position or to exit a position. For example, if a price is approaching a resistance level above which a new trend is expected to develop, a buy stop order could be placed to be triggered if the resistance level is penetrated in a breakout. Or conversely, at a support level, the entry stop order could be placed to sell short once the specified level had been breached. These examples are entry stops. Exit stops are used either to protect capital from further loss, what Edwards and Magee (2007) call protective stops, or to protect profits from deteriorating back into a loss, usually called trailing stops. These stops are defensive in nature and are an absolute necessity once a trade entry has occurred.
Breakout levels and stop-loss levels or zones are similar. Exit stop levels are levels that signal the analysis might be incorrect or at least that the analysis is uncertain and that a position should be exited to protect capital but not necessarily reentered in the opposite direction. Entry stop levels are positioned using the rules for establishing a breakout level or zone or anticipation of a breakout through those levels or zones. The methods described previously for confirming breakouts are equally useful in confirming stop levels.
In an entry stop at a breakout level, an investor is committing new money and increasing the risk that the breakout is valid. In an exit stop, an investor is closing a position and, thus, decreasing risk. This is not to say that stops should be used carelessly. Indeed, by placing stops too close to current price action, an investor can be easily “whipsawed.” A whipsaw occurs when an investor buys a security, the security price falls, the investor sells the security, and then the security price goes up above the original purchase price. The investor’s original opinion was correct, but he still lost money. The word whipsaw comes from the timber industry, where a long, thin, two-man wood saw would often get caught in a log, if not properly handled, and whip the sawyers back and forth without cutting the wood and subjecting them to “two damaging and usually opposing forces at the same time” (www.Randomhouse.com). The whipsaw resulted from lack of analysis and lack of patience, just as in investing.
2. Changing Stop Orders
The most important underlying principle for defensive stops, because they protect one’s capital but at the same time may imply the original analysis was wrong, is that they should never be moved away from the trend of the security. In other words, if one is long a security and has placed a stop at a reasonable level below the current price, he should never cancel or reduce the stop order. Its purpose is to keep the investor honest. By changing or canceling the stop, especially when the security is trading at a loss, the investor is losing discipline and reacting to emotional pressures having to do with not desiring to admit an error—a natural and strong human emotion, but unrelated to the rational assessment of the price action. If a decision about the security originally is made with the best logic and information available and a stop is placed when the analysis will obviously be incorrect, changing it or canceling it negates all the original thought and analysis. The stop may be adjusted along with price as a trailing stop or one that follows each successive change in support or resistance in the direction of the trend as the position progresses profitably, but it should never be canceled or changed against the trend.
Many investors and traders place stops too close to the current price of the security in which they have a position. This often causes whipsaws, even when the stop is adjusted for volatility. A defensive stop is a protection device. It is not necessary for short-term trading, but it’s still preferred. Often, because they don’t want to lose any amount of profit, investors will place a stop too close to the current price and be closed out too early in a longer move. A better method is to allow the security “breathing” room and place the protective stop below where the breathing room correction would be serious. We know that security prices retrace their advances in a progression of steps along the trend, and we know that we will never buy and sell at the absolute peak or trough. We also know that we have to decide upon what time horizon we want to play. Once that is decided, placing a stop based on a shorter time period only invites whipsaws. It is better to wait for the retracement and let the security “breathe.”
On the other hand, if the overall market appears ready to reverse, and one’s security has run along with the market but is also showing signs of fatigue, a trailing stop close to the current price is sometimes warranted. When a position will likely be closed soon anyway, for whatever reason, tightening the stop just allows the marketplace to make the decision rather than the investor or trader.
3. What Are Protective Stops?
Whenever a position is initiated, usually even before initiation, a protective exit stop level must be determined and placed with the entry order. The reasons are twofold. First, the protective stop protects capital. Not every entry is correct and ends up with a profit. Indeed, many traders have more losing trades than winning trades, but they are able to profit because of the judicious use of their stops. They place protective stops at a level where they know if the trade reaches that level, it will be unsuccessful, and when a trade works, they run with the profits until the trend appears to be reversing. The protective stop, therefore, is necessary in any investment endeavor. Even standard fundamental analysis should use some kind of stop. It is ridiculous to think that when entering a trade or investment, it will always be successful and risk of loss should be disregarded.
The second reason a protective stop is necessary is to determine what capital risk the trader or investor is accepting in the trade. By establishing a stop level (and placing an order to that effect), the investor now knows exactly what capital risk is being taken. Assume that a stock breaks upward out of a resistance zone at $20, and the entry stop is triggered so that the investor is now invested in the stock at $21. By analyzing previous support, trend lines, and other technical data, the investor determines that if the stock should sink to $17 (perhaps that is a support level or a trend line level adjusted for confirmation), there is something wrong with the analysis that suggested that the price would be rising. The need to know what is wrong is unnecessary because the stock price action itself is suggesting that something is wrong. Rational investment management would then get out of the stock until what is wrong is understood and evaluated. Technical analysis tells the investor at what price this exit should be made. Once the $17 price is determined as the exit point, the risk of the trade has been determined to be $4—the difference between the entry and potential exit prices. Knowing that the risk is $4 makes the money management problem considerably easier. Say the investor has $100,000 and never wants to risk more than 10% of capital in any one investment. A 2,500 share position with the risk of losing $4 is a $10,000 risk in a $100,000 portfolio, or 10%. No other investment method is as useful for measuring risk of loss. If the best exit point was $16 rather than $17, the risk would be $5 per share, and the ideal position to limit loss to 10% of the portfolio would be 2,000 shares. By knowing the risk level, the investor can thus adjust the amount of shares to be purchased to limit his risk to a predetermined acceptable level.
All stops should be placed based on the price action of the security and the level at which a reversal in trend is likely. Generally, these are trend lines or support or resistance levels. The methods using percentages or points from entry do not address the action of the price and are not adjusted to it. Instead, these levels are purely arbitrary. These rules will often stop out a position before a crucial level is reached or long after it has been penetrated. Exits always should be placed at logical levels of price based on the analysis of trend, support and resistance, volatility, and pattern, not on the peculiarities of a particular portfolio or on an arbitrary rule.
4. What Are Trailing Stops?
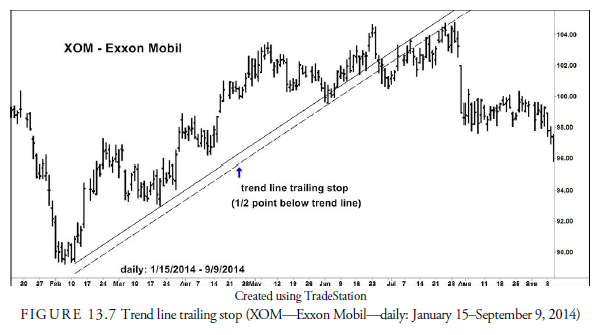
When a security is in a recognizable trend, a trailing stop can be used to avoid the potential loss of profits. Edwards and Magee called these stops “progressive” stops. These trailing stops are necessary because, for instance, in a significant uptrend, the prior support or resistance level may become a substantial price distance from the current price. For example, consider Figure 13.7. Assume that you initially enter a long position in March, with a protective stop placed at the March low price. As the stock continues trading in an upward trend over time, the price gets further and further from this initial stop point. By May, you have made a substantial profit. Setting a trailing stop will help you lock in that profit if the uptrend reverses. If you kept the stop at the original March level, you could watch the price fall by a large amount, and your profits would disappear before the protective stop was activated.
5. Trailing Stops Using a Trend Line
The easiest method of establishing a trailing stop is to follow the trend line with a confirmation filter similar to those used in standard breakouts, as shown in Figure 13.7. For example, an uptrending stock has a definite, well-defined, standard trend line drawn beneath the recent price history. Setting a stop level below but parallel to the trend line, called a stop line, reduces the number of false breakouts. The interval between the trend line and the stop line can be determined in the same manner as the intervals used earlier for breaks of support or resistance. The stop level must be adjusted with every new bar as it travels along the stop line. If it is triggered and the position closed, profits already accrued would not be appreciably affected, at least not as much as waiting for a previous support or resistance level to be broken would adversely affect them, yet the stop level is far enough away from the trend line not to be triggered with a false breakout.
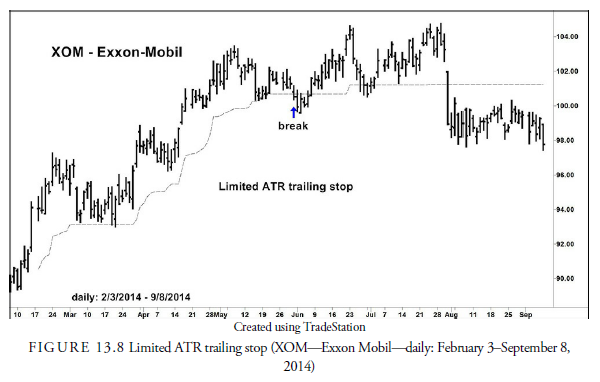
Another method of trailing stop designed to account for the intrinsic volatility of the security is to measure some fraction of the security’s ATR from its latest reversal point. This method is often called a “C handelier Exit.” For example, assume you are long a security rising on an accelerated trend that reaches a high of $50. The 14-day ATR for this stock is $2.50. Based on an evaluation of the market strength, you decide to place a stop three times the ATR below the recent highest high. (Usually a multiple of 2.5 to 4.0 times the ATR is used.) Therefore, you place a sell stop at $42.50. You don’t consider the trend line or the previous support level, which may be considerably below the current price. This method provides a stop based purely on the price and volatility of the security. When price rises above $50, the stop moves up with the price rise to three times its new ATR below the new high. Figure 13.8 shows what using a limited ATR trailing exit stop looks like. This stop is called a limited ATR trailing stop because under the rule of not allowing a stop to move against the prevailing trend, we have adjusted the pure ATR stop to not decline below a previous stop. Using this method reduces the likelihood that a false breakdown will occur because you are adjusting the stop for the security’s volatility. This method is especially useful when other levels such as a trend line or support level are considerably distant from the current price, and the security is following an accelerated upward trend whose end is difficult to predict.
6. Trailing Stops Using Parabolic SAR
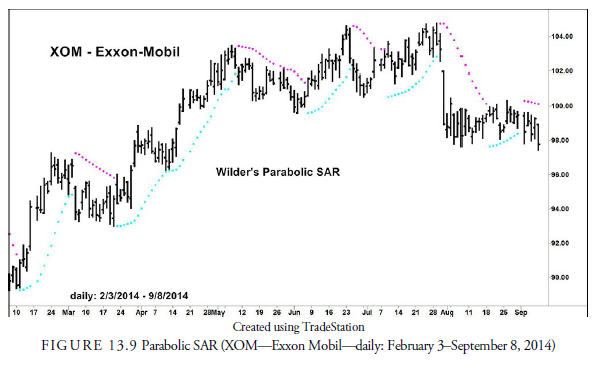
Another trend-following method for setting trailing stops is the parabolic SAR. (SAR stands for “stop and reverse.”) Developed by Welles Wilder (1978), it was initially intended as a trading system because it required a long or short position. However, it has become not only a breakout confirmation rule, but also an excellent, but sometimes sensitive, stop rule.
The parabolic SAR is calculated by using an acceleration factor that increases as the price moves along its trend. Thus, the name parabolic is used because the stop level follows a parabolic curve, as shown in Figure 13.9. The weakness of the formula is that it doesn’t include the security’s volatility and is thus subject to many whipsaws, but since Wilder’s original formula, an ATR component has been included in many parabolic systems. Nevertheless, the acceleration factor is arbitrary and requires some testing for each security to find the best level with the least whipsaws. The concept of a parabolic curve for a stop level is an interesting one, however, and now that it is adjusted for a security’s volatility it may have more value.
7. Trailing Stops Using Percentage of Gain
One final method of determining trailing stops is to place stops at a percentage of each leg in the direction of the trend. This requires that a profit is accruing. On the initial favorable leg, for example, a stop can be placed at 50% of the gain and moved with the gain until after the first retracement. The stop can then be raised as a higher fraction of each successive favorable leg. This method is generally inferior to those methods based on the actual price action.
8. What Are Time Stops?
Time stops are exit stops used to close a position after a predetermined period of time has passed. Time is an investor’s enemy. Uncertainty increases in future time. The longer we look into the future, the less accurate our projections are. This uncertainty is one reason why long-term interest rates are usually higher than short-term interest rates—to account for the risk of something adverse happening over time.
When a trading model or investment method determines that a position should be entered, for whatever reason, the longer that time goes on without a profitable reaction to the position entry, the higher are the chances that the entered position will be unprofitable. Technical analysis is a method of timing investments or trades. To maximize return on capital, capital should not be idle. For this reason, technical analysts often use a time stop to exit a position after a predetermined time, especially if the position is not profitable.
Time stops are also useful in testing mechanical trading methods. All positions must have an entry and exit. Often one is unrelated to the other, but without the ability to analyze both the entry and exit separately, their respective strengths and weaknesses are unknown. To analyze the signal entry, a time stop gives equal weight to all the entry signals being tested.
Instead of using price points at which risk of significant loss is possible, some traders and investors use a money stop. This stop is based on the risk one is willing to take in terms of money. For example, in the previous description of the protective stop, the investor was willing to risk $10,000. Instead of determining from the analysis at what point the security is at risk of major loss, the investor determines how far down the security may decline before the $10,000 is lost. With this method, investors enter into an arbitrary number of shares at their choosing without any analysis of the price point at which the position should be closed and then allow the balance in their investment account to tell them when to sell. From the strategic and money management viewpoint, this method is a poor way to establish a protective stop. The better method is to determine the risk points in the security and work from there. A money stop is based not only on the price change but also on the amount of securities or contracts entered. It is, thus, not a good method of determining when the chance of further loss has increased and will often cause expensive whipsaws, especially if the position has a large number of shares or contracts and is exited after only a small change in price.
As you can see, there are numerous variations of stops. The technical analyst usually tests a variety on the securities being traded and sticks with the most successful method.
9. How Can Stops Be Used with Breakouts?
A breakout above resistance or below support signals a change, usually in trend direction. A trend line breakout is a warning of change but not necessarily of a reversal in direction. The most used breakout is the breakout from support or resistance or from a trend line. In Chapter 15, we cover chart patterns. Almost all patterns are made of trend lines and support or resistance lines. The most reliable chart patterns are completed on a breakout, usually through support or resistance. Most strategies utilizing chart patterns, therefore, must have a way of recognizing a breakout, measuring its importance, and confirming it.
10. Using Stops When Gaps Occur
Some traders act directly on the breakout and are willing to pay the extra price generated by the enthusiasm associated with the breakout. This is usually a wise decision when the breakout creates a gap (see gaps in Figure 13.10). A gap occurs when a security opens and trades at a range totally outside the previous day’s range. In other words, there is no overlap between one day’s trading prices and the previous day’s trading prices, and a gap appears between the bars for the two days on a chart. A gap is usually a sign that important information was released during the period between the bars that had an extraordinary effect on the buyers and sellers. If the reason for the gap is legitimate, the price continues in the direction in which it broke out. When the gap is closed (“covered” or “filled”), however, there is the danger that the gap was false and prices will reverse their trend. Thus, a protection stop should be placed below the gap opening. We discuss the different kinds of gaps in Chapter 17, “Short-Term Patterns.”

11. Placing Stops for a False (or “Specialist”) Breakout
Figure 13.11 shows an example of an upward “specialist breakout.” This false breakout triggers all the buy stops placed to protect against a loss from an upward reversal in a downward trend or to enter a new long position. Prices, with no follow-through, then reverse again, and they break back down through the earlier breakout level, leaving many investors with a loss. Those who bought to cover their shorts on a protective stop now have no position during the subsequent correction, and those who entered a long position now have a loss. The false upward breakout caught them. It is often called a specialist breakout from the days when specialists and market makers would buy stocks heavily at the edge of a resistance level and create a false breakout that, once it caught on and forced the public to buy after the breakout, they would sell into at a profit. Thus, the breakout upward shown in Figure 13.11 was preceded by heavy volume and an accelerating upward curve, giving the impression that the stock was soon to explode upward. Whether this false breakout was a manipulation is somewhat irrelevant today, but breakouts of this type do occur quite frequently and, if not protected against, can be painful.
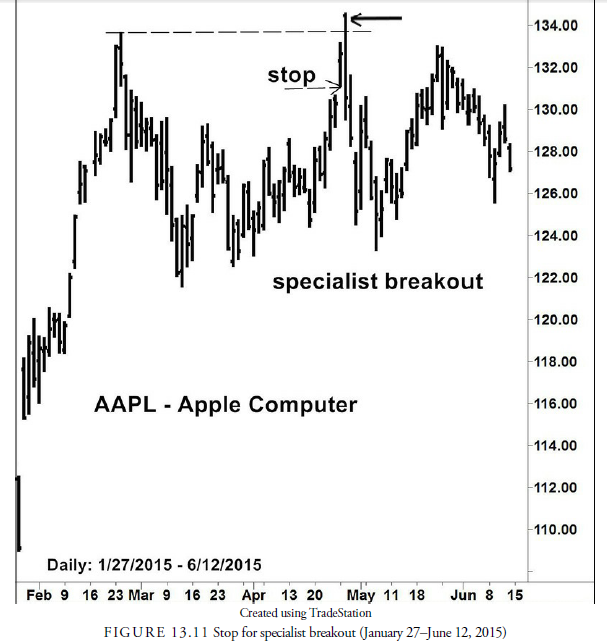
To protect against these losses, the astute investor or trader who participated in the breakout will place another close sell stop slightly below the breakout level, as shown on the chart, and then an entry stop below the low of the bar preceding the breakout bar. If prices quickly reverse downward, the trader will cover losses and make a profit from the second stop being triggered. If the breakout is true, neither of the sell stops will be executed.
Thus, a specialist breakout is a tradable formation. In the chart example, should the trader have no position but see the upward breakout, rather than trade the breakout, she could place a stop below the breakout bar in case the breakout is false. If the breakout is false and triggers the trader’s entry stop, she makes a quick profit, and if it does not trigger, she doesn’t lose anything.
The most important point about trailing stops, or any kind of stop, is to test the method first. It is remarkable how much a stop, if properly placed, can improve performance over just an arbitrary stop placement.
Source: Kirkpatrick II Charles D., Dahlquist Julie R. (2015), Technical Analysis: The Complete Resource for Financial Market Technicians, FT Press; 3rd edition.
Good info. Lucky me I reach on your website by accident, I bookmarked it.