Two types ofhypothesis tests appear in regress output tables. As with other common hypothesis tests, they begin from the assumption that observations in the sample at hand were drawn randomly and independently from an infinitely large population.
- Overall F test: The F statistic at the upper right in the regression table evaluates the null hypothesis that in the population, coefficients on all the model’s x variables equal zero.
- Individual t tests: The third and fourth columns of the regression table contain t tests for each individual regression coefficient. These evaluate the null hypotheses that in the population, the coefficient on each particular x variable equals zero.
The t test probabilities are two-sided. For one-sided tests, divide these p-values in half.
In addition to these standard F and t tests, Stata can perform F tests of user-specified hypotheses. The test command refers back to the most recently fitted model such as anova or regress. Returning to our four-predictor regression example, suppose we with to test the null hypothesis that both adfert and chldmort (considered jointly) have zero effect.
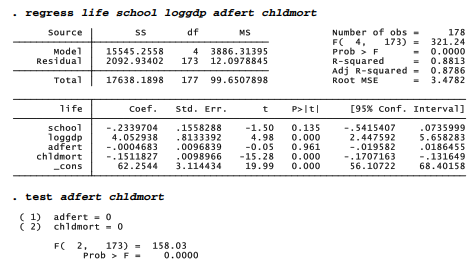
While the individual null hypotheses point in opposite directions (effect of chldmort significant, adfert not), the joint hypothesis that coefficients on chldmort and adfert both equal zero can reasonably be rejected (p < .00005). Such tests on subsets of coefficients are useful when we have several conceptually related predictors or when individual coefficient estimates appear unreliable due to multicollinearity.
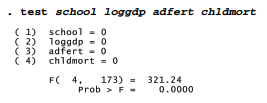
test could duplicate the overall F test:
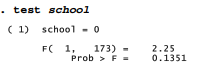
test also could duplicate the individual-coefficient tests. Regarding the coefficient on school, for example, the F statistic obtained by test equals the square of the t statistic in the regression table, 2.25 = (-1.50)2, and yields exactly the same p-value:
Applications of test more useful in advanced work (although not meaningful for the life- expectancy example at hand) include the following.
- Test whether a coefficient equals a specified constant. For example, to test the null hypothesis that the coefficient on school equals 1 (H 0 😛1 = 1), instead of testing the usual null hypothesis that it equals 0 (H 0 😛1 = 0), type
. test school = 1
- Test whether two coefficients are equal. For example, the following command evaluates the null hypothesis H 0 😛2 = P3
. test loggdp = adfert
- Finally, test understands some algebraic expressions. We could request something like the following, which would test H 0 😛2 = (P3 + P4) / 100
. test school = (loggdp + adfert)/100
Consult help test for more information and examples.
Source: Hamilton Lawrence C. (2012), Statistics with STATA: Version 12, Cengage Learning; 8th edition.
I haven?¦t checked in here for some time because I thought it was getting boring, but the last few posts are good quality so I guess I will add you back to my daily bloglist. You deserve it my friend 🙂