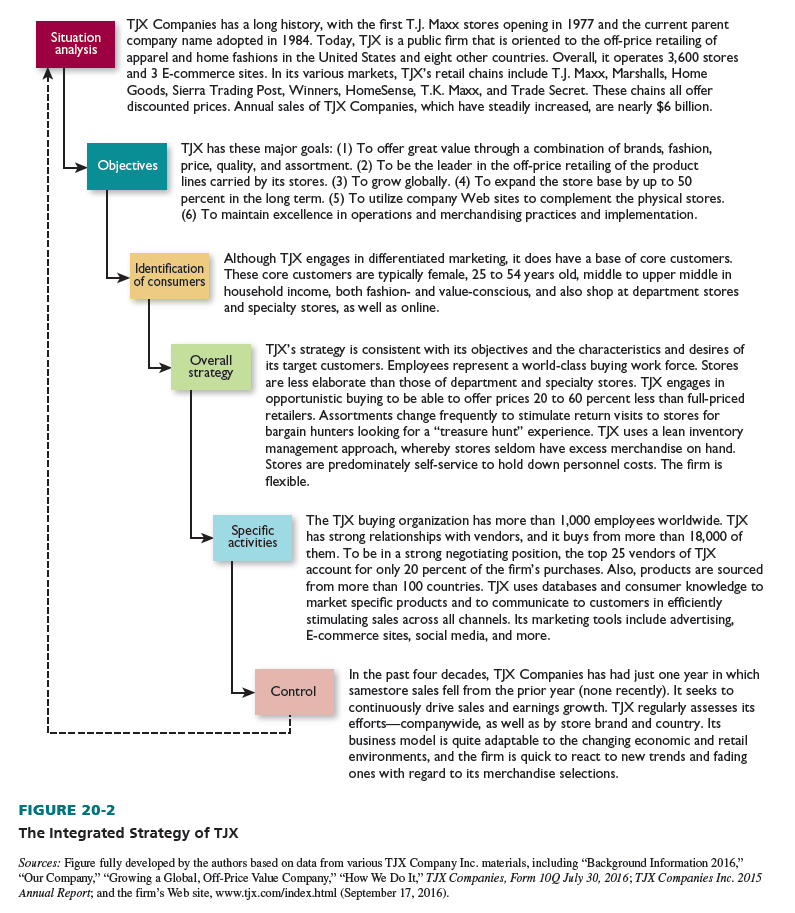
A major goal of Retail Management has been to describe the relationships among the elements of a retail strategy and show the need to act in an integrated way. Figure 20-2 highlights the integrated strategy of TJX, the off-price apparel retailer. TJX has been cited as a “high performance retailer”—and it outperforms most retailers. From fiscal 2011 through fiscal 2016, TJX’s sales rose every year. And, despite price pressures from the weak economy, its gross margins and profits remained strong.4 At our blog site (www.bermanevansretail.com), there are posts on integrated retail strategies.
Four fundamental factors especially need to be taken into account in devising and enacting an integrated retail strategy: planning procedures and opportunity analysis, properly defining productivity, performance measures, and scenario analysis. These factors are discussed next.
1. Planning Procedures and Opportunity Analysis
Planning procedures are enhanced by undertaking three coordinated activities. The process is then more systematic and reflects input from multiple parties:
- Senior executives outline the firm’s overall direction and goals. This provides written guidelines for middle- and lower-level managers, who get input from various internal and external sources. These managers are encouraged to generate ideas at an early stage.
- Top-down plans and bottom-up or horizontal plans are combined.
- Specific plans are enacted, including checkpoints and dates.
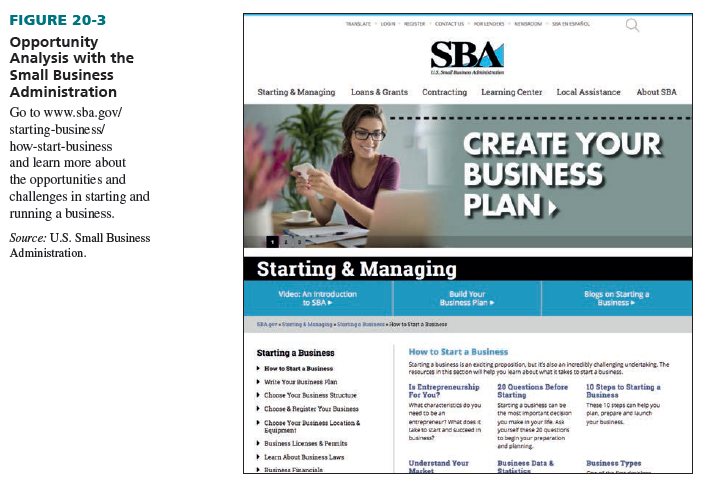
Opportunities need to be studied with regard to their impact on overall strategy and not in an isolated manner. See Figure 20-3. The growth strategy of retailers expanding globally has often been via brick-and-mortar stores. With many global retail markets maturing and significant technological disruptions impacting domestic and international markets, retailers need to consider whether they prioritize digital or brick-and-mortar expansion or use an omnichannel bricks-and- clicks approach. Retailers can be successful with any or all of these approaches, but the strategy development process must include understanding the digital potential and brick-and-mortar potential of each market, and how it is evolving over time. Retailers must analyze and understand their company business models, capabilities, priorities, and preferences before finalizing channel strategy decisions.5
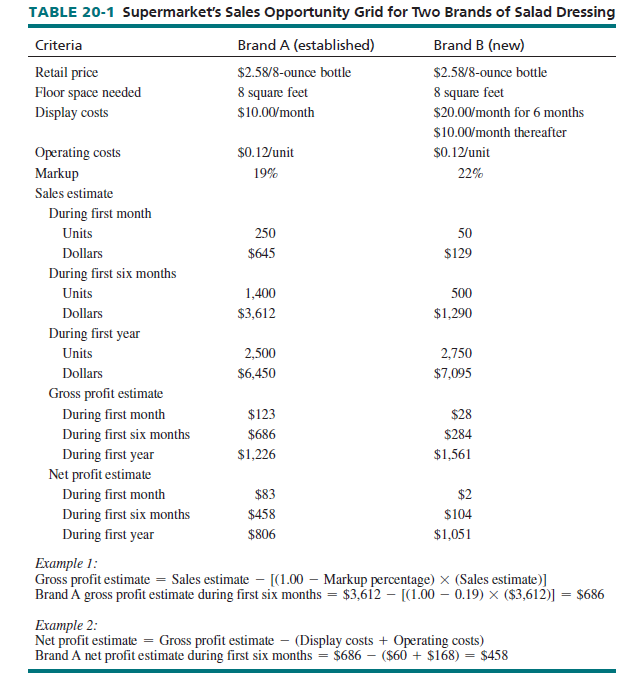
A useful retailer tool for evaluating opportunities is the sales opportunity grid, which rates the promise of new and established goods, services, procedures, and/or store outlets across a variety of criteria. Opportunities can be rated in terms of the integrated strategies the firms would follow if those options are pursued. Computer software makes it easy to use such a grid.
Table 20-1 shows a sales opportunity grid for a supermarket deciding which of two salad dressings to stock. Brand A is established; Brand B is new. Due to newness, the store believes Brand B sales would initially be lower, but first-year sales would be similar. The brands would be priced the same and occupy identical space. Brand B requires higher display costs but offers a larger markup. Brand B would have a greater gross profit and net profit by the end of the first year. Based on the overall grid, Brand B is selected. Yet, if the store is more concerned about a quick profit, Brand A might be chosen.
2. Defining Productivity in a Manner Consistent with the Strategy
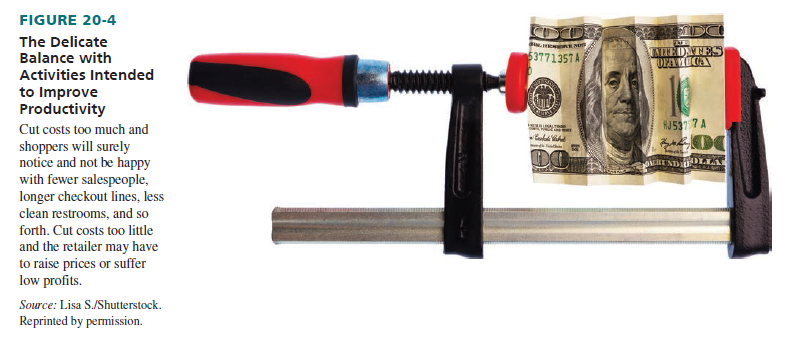
As we noted in Chapters 12 and 13, productivity refers to the efficiency with which a retail strategy is carried out; it is in any retailer’s interest to reach sales and profit goals while keeping control over costs. On the one hand, a retailer looks to avoid unnecessary costs. It does not want eight salespeople working at one time if four can satisfactorily handle all customers. And it does not want to pay high rent for a site in a regional shopping center if customers would willingly travel a few miles farther to a less costly site. On the other hand, a firm is not looking to lose customers because there are insufficient sales personnel to handle the rush of shoppers during peak hours. It also does not want a low rent site if this means a significant drop in customer traffic. See Figure 20-4.
Potential trade-offs often mean neither the least expensive strategy nor the most expensive one is the most productive strategy; the former approach might not adequately service customers and the latter might be wasteful. An upscale retailer could not succeed with self-service, and it would be unnecessary for a discounter to have a large sales staff. The most productive approach applies a specific integrated retail strategy (such as a full-service jewelry store) as efficiently as possible.
Food Lion (part of the Brussels-based Ahold Delhaize Group) is a leading U.S. retailer—with nearly 1,100 supermarkets in 10 Southeast and Mid-Atlantic states. It carries 28,000 nationally and regionally advertised brand name products, as well as high-quality private-label products—as key element of its well-integrated strategy. Its supermarkets are directly owned or affiliates in a wide variety of store formats—supermarkets, online food delivery, and online order pick-up points. Food Lion stores recently underwent extensive remodeling, rebranding (“Easy, Fresh, and Affordable”), and a new three-tier pricing scheme that includes weekly “hot sale” items available to holders of its MVP loyalty card, “WOW” prices on key best-sellers, and “low prices” on essential items throughout the store.6
Ahold Delhaize Group’s U.S. chains include Giant Carlisle, Giant Landover, Hannaford, Martin’s, and Stop & Shop (New England and New York)—each with a distinct go-to-market strategy. Systemwide, the company has responded to a fast-changing retail environment shaped by customer trends, increased penetration of online and mobile usage in-store, higher acceptance of E-commerce (through ownership of the leading online grocer Peapod), and the fresh and organic food concept brand bfresh.7
3. Performance Measures
By outlining relevant performance measures—the criteria used to assess effectiveness—and setting standards (goals) for each of them, a retailer can better develop and integrate its strategy. Among the measures frequently used by retailers are total sales, average sales per store, sales by goods/service category, sales per square foot, gross margins, gross margin return on investment, operating income, inventory turnover, markdown percentages, employee turnover, financial ratios, and profitability.
To properly gauge a strategy’s effectiveness, a firm should use benchmarking, whereby the retailer sets standards and measures its performance based on the achievements of its sector of retailing, specific competitors, high-performance firms, and/or the prior actions of the firm itself. It is necessary to look at internal as well as external standards. The goal of benchmarking is to use peer operating results to generate ideas for improving processes, approaches, considering technologies to reduce costs, strengthen customer satisfaction and loyalty and increase profits.8
A good free source is the “Monthly & Annual Retail Trade” section of the U.S. Census Bureau’s Web site (www.census.gov/retail). It shows about 25 years of data involving a monthly comparison of sales, purchases, gross margins, inventories, and inventory-to-sales ratios by retail category. In addition to monthly and annual store data, quarterly E-commerce data are reported.
Retailers of varying sizes—and in different goods or service lines—can also obtain comparative data from such sources as the Small Business Administration, the Internal Revenue Service, Progressive Grocer, Stores, Chain Store Age, Retailing Today, BizMiner, Dun & Bradstreet, the National Retail Federation, Risk Management Association, and annual reports. Those retailers can then compare their performance with others.
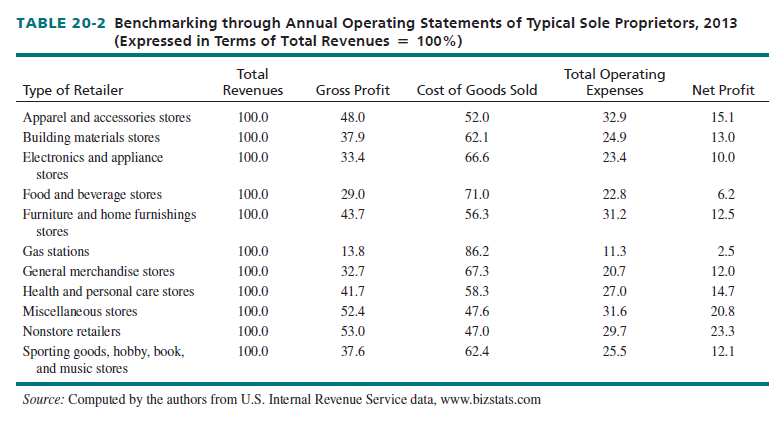
Table 20-2 contains revenue, expense, and income benchmarking data for small retailers in 14 different business categories. The cost of goods sold as a percentage of revenues is highest for gas stations and food and beverage stores, gross profit is greatest for nonstore retailers, operating expenses are the most for apparel and accessories stores, and net income is highest for nonstore retailers.
A popular, independent, ongoing benchmarking survey is the American Customer Satisfaction Index (ACSI; www.theacsi.org), briefly discussed earlier in the chapter. It addresses two questions: (1) Are customer satisfaction and evaluations of quality improving or declining in the United States? (2) Are they improving or declining for particular sectors of industry and for specific companies? The index is based on a scale of 0 to 100. A national sample of more than 70,000 people takes part in phone interviews, with 250 interviews of current customers for each firm studied. In 2015, these were the satisfaction scores for some leading retailers: Amazon.com, 83; Nordstrom, 82; Costco and Priceline, 81; Applebee’s, 79; Bed Bath & Beyond, 75; Home Depot, 73; McDonald’s, 69; and Abercrombies & Fitch, 65.9
There is now great interest in benchmarking service retailers. One well-known measurement tool is SERVQUAL, which lets service retailers assess their quality by asking customers to react to a series of statements in five areas of performance:10
- Reliability. Provide services as promised. Dependably handle service problems. Perform services right the first time and when promised. Maintain error-free records.
- Keep customers informed about when services will be done. Give prompt service. Be willing to help customers. Be ready to act on customer requests.
- Employees must instill customer confidence and make customers feel safe in transactions. Employees must always be courteous and have the knowledge to answer questions.
- Give customers individual attention in a caring way. Have the customer’s best interest at heart. Employees should understand customer needs. Provide convenient business hours.
- Use modern equipment. Provide visually appealing facilities and materials associated with the service. Employees must have a neat, professional appearance.
In reviewing the performance of others, firms should look at the best practices in retailing— whether involving companies in their own business sector or other sectors. For example, the Tompkins Supply Chain Consortium (www.supplychainconsortium.com) includes a number of retailers. By joining the consortium, member companies get information to help them address issues such as:
- How their economic impact compares to that of their competitors and the needed areas of improvement
- How the competitiveness of their cost structures compare to that of their peers and if they are focusing on the right initiatives to optimize results
- How their operations compare to their peers’ operations in terms of efficiency, and what processes (including outsourcing) and technologies are used by leading high-performance companies
- How their peers measure supply-chain performance and how these peers are overcoming obstacles and challenges in the supply chain
- How performance metrics compare to those of their peers and how well they are meeting their objectives
- How their organization structures compare to those of their peers.11
For those retailers expanding internationally, A. T. Kearney (www.atkearney.com), the consulting firm, has devised a Global Retail Development Index (GRDI). It measures the retail prospects in emerging countries with regard to four factors: market attractiveness, country risk, market saturation, and time pressure. According to the 2015 GRDI, China, Uruguay, Chile, Qatar, Mongolia, and Georgia were rated highest. These factors are equally weighted in computing a global retail development index score:12
- Market attractiveness: Based on retail sales per capita, population size, the level of urbanization, and the ease of doing business
- Country risk: Based on political risk, economic performance, debt indicators, and credit ratings, as well as the business costs of crime, violence, and corruption
- Market saturation: Based on the share of retail sales made through a modern distribution format, and the number of international retailers and their market share
- Time pressure: Based on how rapidly sales through modern retail formats have grown, which is an indicator of the time until the market is saturated
A retailer can also benchmark its own internal performance, conduct gap analysis, and plan for the future. Through gap analysis, a company compares its actual performance against its potential performance and then determines the areas in which it must improve. As Figure 20-5 indicates, gap analysis has four main steps.
Let us apply gap analysis to a hypothetical company, ABC Stores. Table 20-3 indicates its financial results for fiscal years that ended in December 31, 2013, through December 31, 2016. The data in the table may be used to benchmark ABC Stores in terms of its own performance. Between 2013 and 2016, ABC Stores saw sales growth rise, fall, and then rise again. The gross margin as a percent of sales remained strong, while operating expenses as a percent of sales declined, but saw an increase in 2016. Profitability declined initially and then rose. The current ratio declined. Inventory turnover fluctuated, but return on invested capital steadily improved. Sales per square foot steadily despite the volatility in its average sale per transaction; and comparable store stores grew consistently. Overall, ABC Stores’ 2013-2016 performance was positive. This signals that the ABC Stores Company was successful in addressing gaps in its performance in the near term, and is regaining momentum.
To ensure gaps are minimized in relationship retailing, firms should do these tasks:
- Customer insight: Analyze consumer data, such as sales, cost, and profits by segment.
- Customer profiling: Collect and merge transaction and lifestyle data to better understand individual shoppers. Identify noncustomers who fit the profile of the firm’s best segment.
- Customer life-cycle model: Analyze shopper behavior at various life stages, and review demographics by segment.
- Extended business model: Based on steps (3) and (4), determine which customers to center on, how best to interact with them, and the best way to build and sustain relationships.
- Relationship planning: Engage in all points of contact (in person, pickup, delivery, kiosk, phone, fax, computer, mobile, tablet) to interact with customers.
- Implementation: Integrate all aspects of the retail strategy.13
At our blog (www.bermanevansretail.com), we have posts related to benchmarking and gap analysis.
4. Scenario Analysis
In scenario analysis, a retailer projects the future by studying factors that affect long-run performance and then forms contingency (“what if’) plans based on alternate scenarios (such as low, moderate, and high levels of competition). Given the rapid pace of change in the industry, this is an important tool for retailers and one that is used extensively to make projections for the future. Retail managers face the challenge of accomplishing their short-term goals while still anticipating disruptions that could alter established processes in the future.14 The significant number of recent store closings and bankruptcies are an indication of dramatic shifts in consumer buying habits and preferences, slow growth in consumer spending despite low unemployment rate, fierce price competition, and the pervasive impact of social, mobile, and Internet of Things technology in retail processes that benefit nimble, online firms at the expense of traditional retailers.15
Some traditional retailers are downsizing and restructuring to better integrate their supply chain so as to provide consistent omnichannel shopping experiences, quality customer service both in-store and online, and faster production of merchandise in response to customer trends. Lord & Taylor is partnering with quick-time supplier Xcel, which owns proprietary brands and labels and provides nimble sourcing to cut delivery time from 9 months to 6 weeks. J. C. Penney will place fewer initial orders of its private-label brands with suppliers in Bangladesh at the start of the season, use consumer data early in the selling season to identify winners, and place additional orders for winners only with Central American suppliers who can deliver in 6 weeks. This approach can help retailers sell more goods at full price similar to fast-fashion retailers such as Zara.16
In planning for its future, Kohl’s (www.kohls.com) has a clear strategic plan. Here are selected elements of that plan:
- Organizational mission and positioning. Kohl’s is positioned as a family-focused, value- oriented department store chain with an E-commerce Web site (www.Kohls.com). It offers moderately priced apparel, footwear, and accessories for women, men, and children, as well as beauty aids and home goods. Stores have a consistent product assortment with some regional differences. It features private and exclusive brands (“Only at Kohl’s”), and national brands. Goals. Kohl’s believes several goals are necessary for long-term success. Its strategic framework, referred to as “the Greatness Agenda,” has five initiatives: “amazing product, incredible savings, easy experience, personalized connections, and winning teams.” These initiatives are expected to increase store and online customer traffic.
- Basic strategy. Kohl’s has clean, bright stores that offer an easy and desirable shopping experience. New mobile and tablet platforms offer an improved in-store digital experience. In 2015, Kohl’s launched “buy online, pick-up in store” (BOPUS) in all stores, thus offering convenience and driving incremental sales.
- Merchandising. About one-half of Kohl’s annual sales are from private and exclusive brands; the other one-half is from national brands. In the early 2000s, 75 percent of Kohl’s sales were from national brands, which have higher selling prices, but lower gross margins, than private and exclusive brands. Its private brands (Croft & Barrow, Sonoma Goods for Life, and others) are well-established and represent the best value in stores. Despite having lower selling prices, private brands generally have higher gross margins. The exclusive brands are developed and marketed through license agreements with recognized brands such as Food Network, Simply Vera by Vera Wang, and others. Their prices are lower than national brands but higher than private-label brands, and gross margins are higher than national brands but lower than private brands.
- Marketing. Kohl’s has a unique “nine-box merchandising grid” (“lifestyle matrix”) to focus its offerings and promotion strategy in a way that relates to both consumer lifestyles and price points.
Posts related to scenario analysis and future planning may be found on our blog (www .bermanevansretail.com).
Source: Barry Berman, Joel R Evans, Patrali Chatterjee (2017), Retail Management: A Strategic Approach, Pearson; 13th edition.
I have been surfing online more than 3 hours today, yet I never found any interesting article like yours. It is pretty worth enough for me. In my opinion, if all site owners and bloggers made good content as you did, the web will be a lot more useful than ever before.
Usually I don’t learn article on blogs, however I wish to say that this write-up very forced me to check out and do it! Your writing taste has been surprised me. Thank you, very nice article.