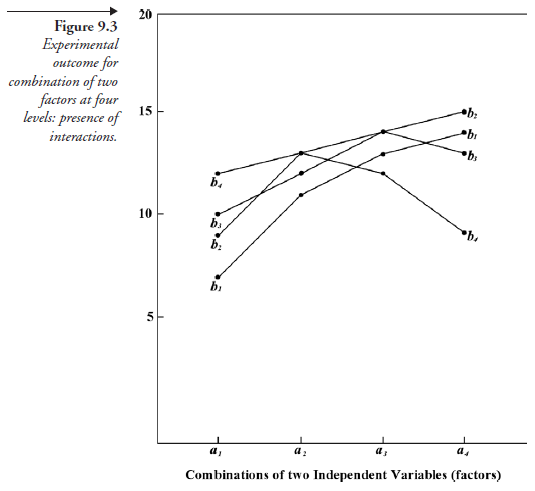
In most cases of research, particularly with quantitative parameters, data as depicted in Figure 9.1, with absolutely parallel lines, are rather rare. A set of data as shown in Figure 9.3, instead, is one of many possibilities. We will examine Figure 9.3 for interaction and for main effects.
We notice in this figure some segments of parallel lines: a2b1— a3b1 is parallel to a2b3— a3b3, and a3b1— a4b1 is parallel to a3b2— a4b2, but no two lines are parallel through the range ai to a4
This is a case of widespread interaction. It is possible to make several qualitative statements based on this data; for example:
- The effect of adding b, at level b>2, with a is fairly additive.
- The effect of adding b, at level b3, with a is beneficial only up to level a3.
- The effect of adding b, at level b4, with a is beneficial only at the lowest level of a, namely ai.
- Any further addition is deleterious.
The above observations are typical of the benefits derived from looking for interactions. Also, it is good to remember that a and b could be purely or partly qualitative parameters, for example, different varieties of rice treated with different brands of fertilizers or with different quantities of a particular fertilizer. In such cases, in statements such as 1 through 4 above, the names of the appropriate parameter will take the places of the levels of a and b, and replacing the word “adding” with the phrase “associating (or treating) with” makes better sense.
Source: Srinagesh K (2005), The Principles of Experimental Research, Butterworth-Heinemann; 1st edition.
5 Aug 2021
5 Aug 2021
4 Aug 2021
5 Aug 2021
5 Aug 2021
4 Aug 2021