The variability in customer demand if not conveyed properly or conveyed with distortion as it travels upstream in the supply chain—the phenomenon called ‘bullwhip effect’—causes either stockouts or inventory pile-ups in the distribution logistics chain. The bullwhip effect is a deformation in information when it goes upstream in the supply chain. The ripple effect of demand volatility results in inventory problems impacting on profitability and customer service of the firm. This happens due to lack of smooth and speedy information flow, resulting in improper coordination and synchronization of actions of supply chain partners. More precisely, the demand of the customer is put out of shape each time it goes from a one decision point to another. Assuming the demand of the customer is quasi-constant, this deformation appears through the amplification of the first mini-fluctuations. Problems tend to escalate in supply chains where communication is minimal between the supply nodes. The situation can be compared to the small wave in the middle of the ocean that may end up as a tidal wave near the shore.
The after-effects of the bullwhip phenomenon can be minimized by using the latest inventory control techniques supported by an efficient and effective information flow system for the supply chain.
The ultimate objective of the inventory control program is to provide maximum customer service at minimum cost. The objectives of inventory management are similar to the objectives of cash management. Various control systems have been developed, which can be classified into two groups.
1. Selective Control Techniques
In these methods the degree of control varies with the importance of the item in the supply chain. The following are the various methods in practice that are commonly used in industries:
2. ABC Analysis
This relates to the annual usage cost of a particular item. A detailed analysis of inventory may indicate that only 10 per cent of items generally account for nearly 70 per cent of usage value. Another 20-30 per cent of items may account for 20 per cent of usage value and the balance 60-70 per cent account for the remaining 10 per cent of usage value. The items are classified per the usage value. While items in class A are less in number, they cost approximately 60-70 per cent of the total cost of the inventory. Class B items cost 20-30 per cent of the total inventory cost, whereas class C items are in greater numbers, yet carry less than 10 per cent of the cost of the entire inventory. In short, this is a financial evaluation for ranking and comparison of inventories. The objective of the classification is to know which item should receive the most attention. An item in class A should have your perpetual attention, while a class C item may be reviewed with less periodicity than class B items. For ABC classifications of inventory see Table 7.2. The first ten items have a value equal to 79.65 per cent of the total inventory value (all items). Obviously first 10 items are ‘A’ class items.

The ABC inventory classification method is thus used to categorize inventory into groups based upon certain activity characteristics. It is the process of classification of products as per the level of importance in terms of their relative criteria such as purchase or sales volume. Examples of ABC classification include:
- ABC by velocity (times sold),
- ABC by sales in rupees,
- ABC by quantity sold or consumed,
- ABC by average inventory investment,
- ABC by margin.
ABC classification is used to develop inventory planning policies; set count frequencies for cycle counting; slot inventory for optimized order picking; and other inventory management activities. It can be described as a technique that is used in a business sense for denoting a categorization of a large volume of data into groups. These groups thereafter can be marked as A, B and C. This means that activities that are considered high on priority are classified as A, those with a lesser priority are grouped under B and the group of activities that are last on the list of priority are classified as C.
3. VED Analysis
This relates to Vital, Essential and Desirable status of the inventory items. As the term implies, certain parts and items are considered to be vital for meeting operational requirements and this aspect is taken into consideration while making the forecast.
The modified version of this is ABC-VED analysis that takes into consideration both value and the criticality of the item. High-value and critical items are under continuous review and ordered in low quantities, while low-value, least critical items are periodically reviewed and ordered in large quantities with lower safety stock requirements.
4. SAP Analysis
Scarce, Available and Plenty status of inventory item is used for planning & forecasting of inventory requirement. The ordered quantity is governed by the scarcity factor. The limitations in supply or obsolescence of an item in the near future will be the guideline for procurement policy decision.
5. FSN analysis
Fast, Slow or Non-moving determines the consumption pattern of an item. However, a consumption pattern where the production run is slowed down for various reasons may not give a realistic picture for procurement action
In all these control techniques, the degree of control varies with the importance of items (Figure 7.3). For example, for the A class vital, scarce and fast-moving items perpetual reviews are recommended, while for B class essential, medium-moving items periodic reviews will be OK. In the case of C class desirable, slow-moving items the periodicity of review will be longer.
6. Inventory Planning Models
Inventory is the main culprit in the supply chain and can influence the bottom line of an organization to a great extent. Over the years, experts have suggested various models for controlling inventory. Only a few models have stood the test of market dynamics. However, the results depend on the model you choose for the right application. Selection of the models depends on various factors as shown in Figure 7.4.

Approaches to inventory control can be categorized into the traditional and modern. Commonly used traditional approaches like EOQ and EBQ are based on certain assumptions that are not valid in dynamic markets. However, these formulas give certain guidelines rather than deciding on exact quantity (see Figure 7.5).
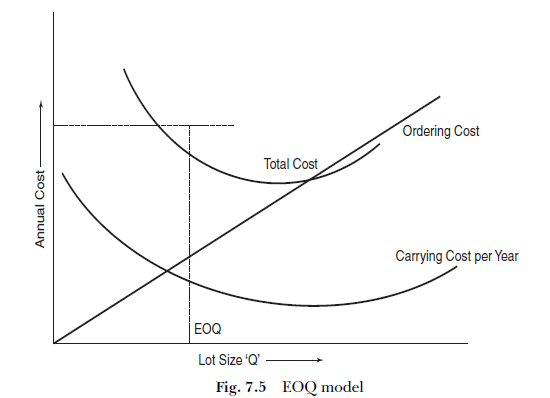
7. Economic Order Quantity
The economic order quantity (EOQ) or economic lot size model is referred to as Wilson-Harris square root formula, since it was devised by Ford Harris and R.H. Wilson independently. The assumptions under this model are:
- Demand is known. It is constant and uniformly spread over a period of time.
- There is no lead time for re-supply of material (i.e. material is supplied instantaneously.)
- The cost of ordering per unit is the same irrespective of the lot size.
In this model, inventory-carrying cost may be taken to be proportional to the average inventory held during a period. Therefore, by reducing the inventory, its carrying cost can be reduced. On the other hand, a smaller lot size will increase the number of lots per year to cover the annual demand and so the cost of ordering will be more. Hence, an economical lot size will have to balance these two opposite costs.
The mathematical formula for economical lot size is:

Where
Q = economic order quantity in units
S = cost of placing an order in Rs.
D = average annual consumption in units
H = percentage of inventory cost vis-a-vis unit cost
C = cost per unit
To go per the formula will be rarely possible because of the following reasons:
- The ordered quantity figure may be modified to take into account the standard pack size available in the market.
- To avail of the quantity discount offered by the suppliers, the order quantity figure may be modified.
- The availability of funds will force the buyer to go for the less than minimum ordered quantity.
- To take care of the anticipated shortage of material in the market, the higher quantities may be ordered.
The EOQ formula is normally used as a guideline rather than to decide on the exact material requirements.
8. Modern Inventory Control Systems
The modern approach to control inventories is focused on the following three factors:
Flow It is concerned with the movement of product from supplier to distribution centers and ultimately to the customer. Here comes the role of logistics operation for planning material flow across the distribution networks based on market demand. This is supported by production planning at the factory.
Flexibility It relates to the flexibility in frequency and volumes in delivery of products to customers. The role of warehouse management is crucial to the success of logistics operations designed to tune in to the service level demanded by target customers.
Balancing Inventory levels have a bearing on the customer-satisfaction level. An inadequate inventory level will create customer dissatisfaction. On the other hand, excess inventory will increase the carrying cost. The latest inventory models are focused on maintaining the delicate balance between the two polemic goals.
Integration The supply chain efficiency and effectiveness is very much dependent on integration. Inventory models are developed for a strategic fit, for both forward and backward integration, to meet the objectives of lower inventory-carrying cost and enhanced customer satisfaction.
9. Material Requirements Planning
The material requirements planning (MRP) concept was developed in the 1970s following the introduction of high-speed computers. MRP system does the work of materials manager to control inventory of items to lean the supply chain. The forecast of inventory items is controlled by the production item on which their demand is dependent. MRP is typically applied to manage inbound material movement in the enterprise and is based on production requirements and scheduling.
MRP system is suitable for both push- and pull-type supply chain systems. In a push system information is required in the form of elaborate material requirement planning for a master production schedule which is further used for creating schedules for suppliers for inventory part/ component types, quantities and delivery dates. In the pull system, information is required on actual demand, which needs to be transmitted extremely quickly throughout the entire supply chain so that production and distribution of parts or products can accurately reflect the real demand (Figure 7.6).

10. Manufacturing Resource Planning—MRP II
MRP II is defined by APICS as a method for the effective planning of all resources of a manufacturing company. It started out as MRP (material requirements planning) and was concerned with ordering and scheduling materials based on inventory. The large-scale introduction of computers led to extensions into a closed-loop MRP II system concerned with the whole manufacturing environment. MRP II works on “push” where a forecast is generated, a manufacturing plan is derived and the plan then drives the manufacturing process via work orders or the purchasing process via purchase orders.
MRP II systems begin with MRP (material requirements planning). Sales forecasts from marketing are input to MRP. These forecasts determine the raw materials demand. MRP and MRP II systems draw on a master production schedule (MPS)—the breakdown of specific plans for each product on a line. While MRP allows for the coordination of raw materials purchasing, MRP II facilitates the development of a detailed production schedule that accounts for machine and labour capacity, scheduling production runs according to the arrival of materials. An MRP II output is a final labour and machine schedule. MRP II system provides data on the cost of production, machine time, labour time and materials consumed and the final output to accounting and finance. MRP is concerned primarily with manufacturing materials, while MRP II is concerned with the coordination of the entire manufacturing and other resources required for manufacturing production, including materials, finance, and human relations. MRP II is not a proprietary software system and can thus take many forms.
In short, MRP II is a long-term planning tool for complex products. It can give an accurate completion date at the time of order, The system fits in with conventional accounting and the progress of manufactures and inventory sizes which are available at all times. It tightly controls work orders and changes therein. However, in MRP II it is necessary to maintain an accurate database. Inventory accuracy requirement is vital to the extent of 99 per cent. MRP II is a computer-based system, inflexible and relies on forecast.
11. Distribution Requirement Planning
Distribution requirement planning (DRP) is one of latest IT tools for controlling inventory in the distribution system of an organization. It is a logical extension of MRP DRP is guided by customer demand, whereas MRP is based on production requirement. DRP allocates inventory from the mother warehouse to the various distribution centers based on the following:
- Demand pattern
- Safety stock provision
- Order quantity
- Reorder point
- Average performance cycle length
DRP also coordinates finished goods requirements across the distribution network (Figure 7.7). DRP system success is dependent on the accuracy of the forecast with respect to location and time of the requirement across the distribution centers. Consistency performance cycle for timely movement of goods across the system is a must for system effectiveness. Uncertainty in performance cycles may defeat the very purpose of the DRP system. Like MRP, DRP is used along with enterprise resource planning (ERP), rather than as a stand-alone system, so as to get the full benefits of ERP on both the procurement and distribution sides. The major benefits of using DRP are:
- Improvements in customer service level
- Effective marketing efforts for high value stock items
- Decrease in inventory level resulting in a decrease in carrying cost
- Decrease in inventory reduces warehouse space requirements
- Helps in effective simulation of transportation and inventory requirements for shipment coordination that results in reduction of inventory-carrying and transportation costs.

12. Just-in-Time System
Just-in-time (JIT) is a concept based on the fact that an activity should not take place until there is need for it. Hence an inventory item should not be brought into the system until it is required for making the final product. JIT is characterized by maintaining zero inventories of raw materials and assemblies at the assembly plant. Therefore, the JIT system involves the close coordination of the buyer and the suppliers on a real-time basis. This means frequent receipts of materials from suppliers. The following are prerequisites to a successful JIT system:
- Buyer-seller partnership
- Online communication and information sharing
- Commitment to zero defects from both the sides
- Frequent and small lot size shipments
The success of the JIT system depends on the mutual trust and commitments of both seller and purchaser. In a nutshell, it is the philosophy of “Help, to get helped.” However, there is also the flip side. The main barriers to the successful operation of the JIT system are:
- Organization structure
- Organization culture
- Technology differentials at buyer and supplier ends
- Reluctance to information sharing
- Dispersed suppliers
The JIT system has its success stories in Japan where it originated. The adoption of JIT by Americans could not bring in the desired benefits, resulting in their moving to other techniques. The reason for the Americans’ unsuccessful adoption of the system lies in the decision-making culture required to operate the JIT system. Success depends on collaborative relationship and decisions reached by group consensus rather than made by individuals empowered by an organization based on an authority structure. To make JIT a success, total cultural and structural changes are needed in both buyer and purchaser organizations and they should operate from mutually beneficial policy platforms.
Toyota implemented JIT inventory management wherein it receives its supplies from its vendors spread all over the country on a daily basis. It uses the ‘mixed loading’ concept, where a single truck is loaded with all components supplied by different vendors, considering the daily production requirements. As a result, the company is able to run almost zero inventories for its production line. It has also managed to do away with the uncertainty in transportation by appointing a dedicated transporter for the overall movement. The TKM supply chain is characterized by:
- Collection of material through “milk run” across all vendors located in different parts of the country at hub centers where checking, consolidation and stacking is done.
- Main route vehicle moves from the hub to the TKM plant carrying all ‘milk run‘ collection.
- Bulk movement is direct from vendors to the TKM plant
- All vehicles run per a predetermined time schedule
- Vehicles are provided with a hydraulic loading ramp.
- All drivers give status calls twice daily about their location. In case of an eventuality, they seek instructions to ensure goods reach on time.
- Visual display boards are maintained at control room to monitor every vehicle.
Toyota Logistics System being operated through TRANSSYSTEM has lead to reduce average inventory level just under two days (as compared to 30 days), zero-defect delivery 99.8 per cent on time and
13. Vendor-Managed Inventory
Vendor-managed inventory (VMI) is a new concept that has been made popular by the Bose Corporation. It is now widely used in the industry with encouraging results. In VMI the supplier takes charge of inventory management of products and manages the replenishment process based on the consumption pattern of the customer. They use EDI or other inter-organizational software packages or place the supplier’s representative at the customer’s place.
In India a leading commercial vehicle manufacturer allowed the tyre supplier to open a small inventory shop in his manufacturing premises to supply tyres for the day’s production of commercial vehicles. The supplier keeps three days inventory in the area allocated to him along with his representative to manage the shop and hand over tyres to the customer per the assembly line requirements for the day. Inventory replenishing is done once in two days by direct truckloads of tyres from the supplier’s manufacturing plant. This is based on the advanced production planning for the coming week. A daily payment by cheque is made for the quantity of tyres drawn from the supplier’s shop. The result is a huge reduction in the inventory level, now down to 3 days’ stock (inventory stock for 15 days was held before by the vehicle manufacturer). Besides, the inventory is now entirely managed by the vendor, who gets the payment daily for the supplies made. This truly is a win-win situation, beneficial to both the buyer and the supplier.
For VMI to be successful, three things are essential, viz. the right partners, the right set of products and mutual trust. By “right partners” is meant, those who have proved themselves on consistency in quality, low cost transactions and reliability as far as on-time delivery is concerned. VMI is appropriate for products that have high volumes and values, involve huge carrying cost for the inventory to be maintained. In VMI, the partnership is based on mutual trust, which implies a willingness on the part of the buyer to share information and capabilities with the supplier as well as allow the latter to partake of the benefits resulting from a close collaboration of this kind; and an assurance on the part of the supplier to be reliable and consistent on agreed delivery schedules. The benefits of VMI are reduction in inventory-related costs risk of stockouts and for the vendor speedy payment realization, reduction in transaction cost, and the assured business. It is rightly said that VMI is the starting point for greater collaboration among supply chain partners and by graduating from a one-sided replenishment responsibility to collaborative replenishment results in greater value being derived for the supply chain.
14. Automated Inventory Tracking System (AITS)
This system is adopted by the leading U.S. retail chain giant Wal-Mart to track inventory based on the sales generated. The system involves usage of the electronic data interchange (EDI) system to track the flow of inventory through the supply chain. The system connects suppliers, manufacturers, distribution hubs and retail stores and institutional buyers. The system is based on integrating EDI and the bar coding system to track inventory for controlling inventory investment through the supply chain.
Source: Sople V.V (2013), Logistics Management, Pearson Education India; Third edition.
Pretty! This was a really wonderful post. Thank you for your provided information.