Up to this point, we have examined latent growth curves that were linear in nature. Latent growth curves can assess nonlinear patterns as well. If you think your data might have linear and quadratic components, latent growth curves can assess the growth between time points and also assess the potential curvilinear nature of the data. In our latent growth curve exam- ple, AMOS will initially default a model with two unobserved variables of intercept and slope. If you think a quadratic component is present, you need to add a third unobservable vari- able. Let’s call this third unobservable “Quadratic”. We are going to include a parameter to each time period (observables) in the model. To reflect the quadratic nature of this test, we will place a “−1” for time period 1. For time periods 2 and 3, we will label the parameter a “1”; and for the last time period, we will label that parameter a “−1”. With the Quadratic unobservable, we are going to examine the mean values. A negative mean value in the Quad- ratic variable means that either the data is curving upward or the change in values are increas- ing steeply over time. A positive mean indicates that the data is curving downward or the values are decreasing steeply over time.We are also going to add a covariance between all the unobservables in the model.
Let’s run the analysis and go to the “Estimates” link in the output.
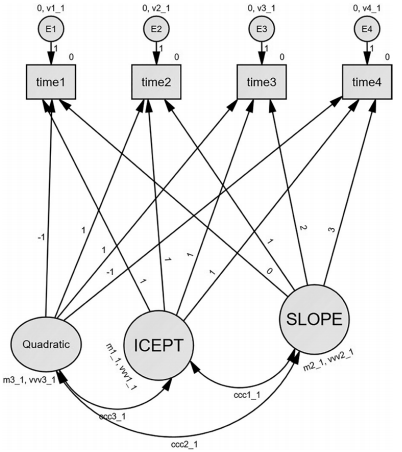
Figure 9.17 AMOS Latent Growth Curve Model Testing for a Curvilinear Pattern

Figure 9.18 Estimates Output Testing the Quadratic Effects for the Sustainable Package Group
I solely used the sustainability packaging group in this example, but if you want to perform a two group analysis to see if the intercept, slope, and quadratic pattern are different across the groups, you just need to label the mean and variance for each group and then constrain those values across the groups. In the example provided, I labeled the quadratic variable’s mean m3_2 and the variance vvv3_2. So, in the comparison test, you would constrain slope, intercept, and quadratic pattern to be equal across the groups.You can then run a two group analysis which would tell you if there were differences across the groups and also determine if the quadratic nature of the data was significant across the groups.
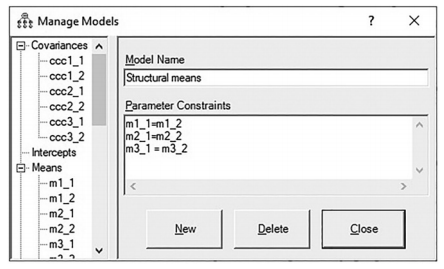
Figure 9.19 Constraining Parameters Across the Groups for the Slope, Intercept, and Quad- ratic Variable.
Source: Thakkar, J.J. (2020). “Procedural Steps in Structural Equation Modelling”. In: Structural Equation Modelling. Studies in Systems, Decision and Control, vol 285. Springer, Singapore.
30 Mar 2023
27 Mar 2023
20 Sep 2022
28 Mar 2023
29 Mar 2023
29 Mar 2023