We have already addressed how to find respondent abandonment, but finding missing data that takes place in a random manner can be more challenging. To initially see if any data is miss- ing, let’s start in the SPSS data file. In SPSS, go to the “Analyze” option at the top, then select “Descriptive Statistics”, and then the “Frequencies” option.
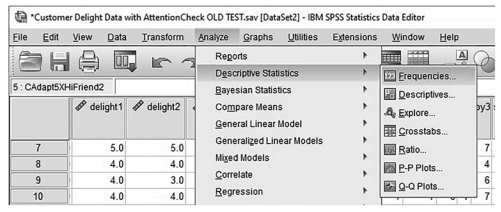
Figure 2.4 Frequencies Function in SPSS
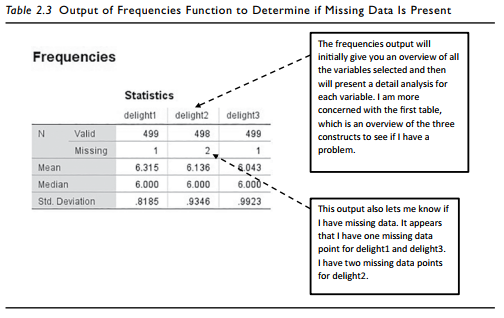
After choosing the “Frequencies” option, a screen will appear (Figure 2.5) where you will select the three delight indicators and move them into the Variable(s) input section. I also like to choose the “Statistics” option on the right-hand side of the screen in order to select all the information I want presented. After selecting all the needed options, I hit the “Continue” but- ton and then the “OK” button in the initial “Frequencies” window.

Figure 2.5 Frequencies–Statistics Options
Source: Thakkar, J.J. (2020). “Procedural Steps in Structural Equation Modelling”. In: Structural Equation Modelling. Studies in Systems, Decision and Control, vol 285. Springer, Singapore.
30 Mar 2023
28 Mar 2023
21 Sep 2022
29 Mar 2023
31 Mar 2023
29 Mar 2023