We have selected several patterns to highlight based on their combination of high gains and minimum failure rates. Other patterns can also be successful if monitored closely, but the “edge” appears to be in these patterns.
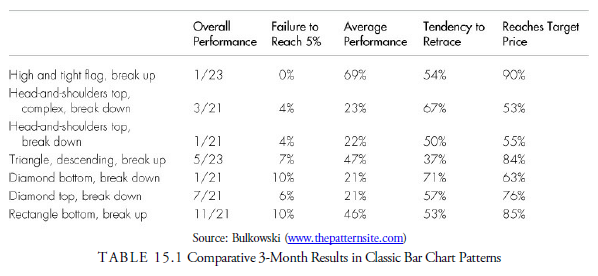
According to Bulkowski (2015), the best-performing patterns, considering gain and risk, are the high-and- tight upward breaking flag, the head-and-shoulders top, top islands breaking down (to be covered in Chapter 17), and upward breaking descending triangles. A summary of these patterns is shown in Table 15.1.
Source: Kirkpatrick II Charles D., Dahlquist Julie R. (2015), Technical Analysis: The Complete Resource for Financial Market Technicians, FT Press; 3rd edition.
Great website. A lot of useful info here. I am sending it to some friends ans additionally sharing in delicious. And obviously, thanks on your effort!