1. THE RELATIONSHIP BETWEEN QUALITY AND COMPETITIVENESS
The relationship between quality and competitiveness is best illustrated by an example from the world of athletics. Consider track star Juan Arballo. In high school, he was his track team’s best sprinter. Competing at the district level, Juan easily topped the competition in such events as the 100-, 200-, and 400-meter runs and several relays in which he was the anchor. He did well enough in high school to win a college scholarship. However, at the college level the competition was of a higher quality, and Juan found he had to train harder and run smarter to win. This he did, and although he no longer won every race, Juan did well enough to pursue a spot on the U.S. Olympic team. In the Olympic Trials, the quality of the competition was yet
again better than that to which Juan was accustomed. He made the Olympic team but only in two events: the 200- meter dash and the 4 x 100 relay.
In the preliminary events at the Olympics, Juan Arballo found the quality of his competitors to be even better than he had imagined it would be. Some competitors had preliminary times better than the best times he had ever run in meets. Clearly, Juan faced the competitive challenge of his career. When his event was finally run, Juan, for the first time in his life, did not place high enough to win a medal. The quality of the global competition was simply beyond his reach.
In this example, at each successive level of competition the quality of the competitors increased. A similar phenomenon happens to businesses in the marketplace. Companies that used to compete only on a local, regional, or national level now find themselves competing against
companies from throughout the world. Like Juan Arballo, some of these companies find the competition to be more intense than any they have ever encountered. Only those who are able to produce world-class quality can compete at this level. In practical terms, it is extremely important for a country’s businesses to be able to compete globally. When they can’t, jobs are lost and the quality of life in that country declines correspondingly.
How Quality and Competitiveness Encourage Job Satisfaction and Financial Benefits
Human resource professionals know that job satisfaction is affected by several factors including working conditions, opportunity for advancement, workload, stress level, relationships with co-workers, relationships with supervisors, and financial benefits. What is less known is that all of these job satisfaction factors are affected by an organization’s commitment to quality and, in turn, competitiveness. The formula is simple. The better an organization’s quality is, the more competitive the organization is. The more competitive an organization is, the better everything in the organization functions.
For example, because everything that affects quality and competitiveness is continually improved in an organization that is committed to total quality, working conditions, workload, and stress levels tend to be better in the organization. Because competitive organizations have no trouble finding customers for their products and services, they are able to stay in business and even grow which, in turn, provides opportunities for advancement. In addition, because competitive organizations generate a profit, they are better able to reward their personnel financially (salary, benefits, bonuses, incentive pay, and perquisites).
Finally, in competitive organizations that continually improve quality, interpersonal relationships among employees and between employees and supervisors tend to be more positive because the quality of these relationships is stressed and continually improved. Further, relationships always go better when they are not complicated by the stress of wondering about layoffs, reductions in force, restructuring, buyouts, and all of the other pressures inflicted on employees of organizations that struggle to stay in business. In short, everything tends to work better in organizations that effectively use quality management to maintain their competitive edge.
2. COST OF POOR QUALITY
Many business executives adopt the attitude that ensuring quality is good thing to do until hard times set in and cost cutting is necessary. During tough times, quality initiatives are often the first functions to go. Companies that take this approach are those that have never integrated continual quality improvement as a normal part of doing business. Rather, they see it as a stand-alone, separate issue. What executives in such companies fail to calculate or to even understand is the costs associated with poor quality. This ironic dilemma is best illustrated with an example of two companies.
2.1. A Tale of Two Companies
Two companies, ABC Inc. and XYZ Inc., both need to compete in the global marketplace in order to survive. As might be expected, over the years competition has become increasingly intense. In order to be more competitive, ABC’s executives undertook a major company-wide cost-cutting initiative. They eliminated quality audits; changed from trusted, proven suppliers to low-bid suppliers; purchased new computer systems; cut back on research and development; and reduced customer service staff.
These cost-cutting strategies did have the desired effect of decreasing the company’s overhead, but they also had the unplanned consequences of disrupting the company’s ability to satisfy customers and reducing the company’s potential to develop new business in the future. The net outcome of all this was unhappy customers, disenchanted employees, and a decline in business. To make matters even worse, the company was still struggling with the poor performance record that caused its executives to want to cut costs in the first place.
The executives of XYZ Inc. also needed to make some changes in order to stay competitive, but they decided to take a different approach. XYZ’s management team set out to identify all of the costs that would disappear if their company improved its performance in key areas. The costs identified included those associated with the following: late deliveries to customers, billing errors, scrap and rework, and accounts payable errors. In other words, XYZ’s executives decided to identify the costs associated with poor quality. Having done so, they were able to begin improvement projects in the areas identified without making cuts in functions essential to competitiveness (e.g., product quality, research and development, customer service).
2.2. Cost of Poor Quality and Competitiveness
Few things affect an organization’s ability to compete in the global marketplace more than the costs associated with poor quality. When an organization does what is necessary to improve its performance by reducing deficiencies in key areas (cycle time, warranty costs, scrap and rework, on-time delivery, billing, etc.), it can reduce overall costs without eliminating essential services, functions, product features, and personnel. Reducing the costs associated with poor quality is mandatory for companies that hope to compete in the global marketplace. Reducing such costs is one of the principal drivers behind the total quality concept of continual improvement.
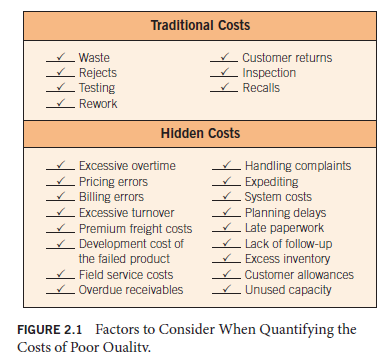
Figure 2.1 summarizes both the traditional and the hidden costs of poor quality. The key principle to understand when examining the hidden costs shown in Figure 2.1 is that if every activity in an organization is performed properly every time, these costs simply disappear.
2.3. Interpreting the Costs of Poor Quality
Once activities have been identified that exist only or primarily because of poor quality, improvement projects can be undertaken to correct the situation. It is important at this stage to select those projects that have the greatest potential to yield the highest return. The following steps can be used to measure the costs of poor quality so that selected improvement projects have the highest priority:
- Identify all activities that exist only or primarily because of poor quality.
- Decide how to estimate the costs of these activities.
- Collect data on these activities and make the cost estimates.
- Analyze the results and take necessary corrective actions in the proper order of priority.
Reducing the cost of poor quality reduces all other costs— product costs, the cost of doing business, and so on. This, in turn, improves the superior value equation: quality, cost, and service.
3. COMPETITIVENESS AND THE U.S. ECONOMY
The United States came out of World War II as the only major industrialized nation with its manufacturing sector completely intact. A well-oiled manufacturing sector and the availability of abundant raw materials helped the United States become the world leader in the production and export of durable goods. This resulted in a period of unparalleled prosperity and one of the highest standards of living ever experienced by any country.
While the United States was enjoying its position as the world’s preeminent economic superpower, the other industrialized nations of the world, particularly Japan and Germany, were busy rebuilding their manufacturing sectors. As Japanese and German manufacturers rebuilt, two things became apparent to them:
- To succeed, they would have to compete globally.
- To compete globally, they would have to produce goods of world-class quality, which meant producing better goods but at reasonable, competitive prices.
Basking in their prosperity, U.S. manufacturers were slow to catch on that the game had changed from mass production with acceptable levels of waste to quality production with things done right the first time every time to provide superior value for customers. The old game was best cost. The new game had become best cost and best quality. When foreign companies—through a combination of better training, better technology, and better management—began to eat away at markets, U.S. companies, mistakenly seeing cost rather than quality as the issue, began sending work offshore to hold down labor costs. By the time U.S. companies learned that quality and value were key to success in the global marketplace, Japan, Germany, Taiwan, and Korea had made major inroads into global markets previously dominated by U.S. manufacturers (e.g., steel, automobiles, computers, and consumer electronics). In a relatively short period of time, the United States went from the world’s leading lender and exporter to the world’s biggest debtor, with a huge balance- of-trade deficit. By 1980, the United States was consuming more than it produced and the trend continues to this day.
Impact of Competitiveness on Quality of Life
A nation’s ability to compete in the global marketplace has a direct bearing on the quality of life of its citizens. Because the ability to compete translates into the ability to do a better job of producing quality goods, it is critical that nations and individual organizations within them focus their policies, systems, and resources in a coordinated way on continually improving both quality and competitiveness.
The United States began the first decade of the new century poised on the precipice of a growing gap between the haves and the have-nots. While Canada, France, Germany, Italy, Japan, Sweden, and Great Britain have taken steps to link economics, education, and labor market policy in ways that promote competitiveness, the United States is still debating the need for an industrial policy and struggling to reverse the decline of its public schools.
During the 1980s, the United States improved productivity by putting more people to work. Other countries improved their productivity by making the individual worker more efficient. Most new entrants into the workforce during the 1970s and 1980s were people who had not worked previously, primarily women. This influx of new workers helped the United States maintain its traditionally high level of productivity. However, by the 1990s, the gains that could be made by increasing the number of people in the workforce had been made.
From 2010 to the foreseeable future, the number of people in the prime working-years age groups in the United States will be on the decline.1 As the size of the workforce continues the downward trend that began in the early 1990s, the only way to improve productivity will be to do what other industrialized countries have done—concentrate on improving the efficiency of individual workers. In other words, businesses in the United States will need to get more work out of fewer workers. As some businesses have already learned, the best way to do this is to adopt the total quality philosophy.
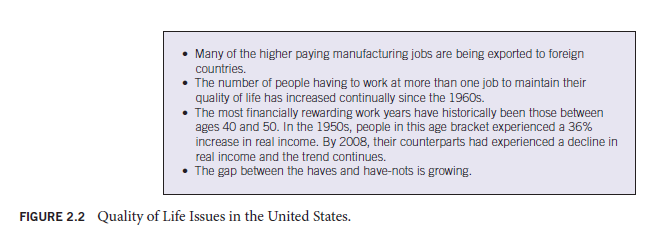
Figure 2.2 contains several vignettes relating to the quality of life in the United States. This figure presents either a bleak picture of bad times to come or an unprecedented national challenge. To meet the challenge, companies in the United States will have to produce world-class value, which will require a commitment to superior quality, cost, and service.
4. FACTORS INHIBITING COMPETITIVENESS
Improving competitiveness on a national scale is no simple matter. Much can be done at the level of the individual company, where the total quality approach can be applied to great advantage, but competitiveness on a national scale requires more than just total quality. Students of quality management must understand this point. Failure to understand the limits of total quality has caused some business leaders to expect too much too soon. This, as a result, has turned them into detractors.
This section describes factors that can inhibit competitiveness but are beyond the scope of total quality. They are socioeconomic and sociopolitical in nature and are indigenous to the United States. In the age of global competition, managers should apply the principles of total quality to help make their individual organizations more competitive. Simultaneously, they should work through the political and social systems as private citizens and community
leaders to help level the playing field among nations by correcting the inhibitors explained in this section. These inhibitors fall into the following categories: business- and government-related factors, family-related factors, and education-related factors.
4.1. Business- and Government-Related Factors
Those U.S. companies trying to compete in the global marketplace are rowing upstream while dragging an anchor. Actually, they drag three anchors. This was pointed out many years ago by W. Edwards Deming when he first set forth his Seven Deadly Diseases. His second, sixth, and seventh deadly diseases are as follows:2
- Emphasis on short-term profits fed by fear of unfriendly takeover attempts and pressure from lenders or shareholders
- Excessive medical costs
- Excessive costs of liability inflated by lawyers working on contingency fees
Each of these diseases adds cost to a company’s products without adding value. Nothing could be worse when viewed from the perspective of competitiveness. A company might equal all competitors point for point on all quality and productivity criteria and still lose in the marketplace because it is a victim of deadly diseases that drive up the cost of its product.
Excessive medical costs and litigation, primarily related to workers’ compensation, have also slanted the playing field in favor of foreign competitors. The annual cost of workers’ compensation to U.S. businesses is almost $30 billion. This is a non-value-added cost that increases the price these businesses must charge for their products. Litigation and the associated legal costs have made tort reform an issue in the U.S. Congress and in the legislatures of most states. However, intense lobbying by trial lawyers has prevented any significant tort reform.
Overcoming these business-related inhibitors will require business and government to work together in a positive, constructive partnership to enact policies that will reduce these non-value-added costs to a minimum. To accomplish this goal, the United States will have to undertake major restructuring of its financial, legal, and medical systems.
4.2. Family-Related Factors
Human resources are a critical part of the competitiveness equation. Just as one of the most important factors in fielding a competitive athletic team is having the best possible players, one of the most important factors in fielding a competitive company is having the best possible employees. Consequently, the quality of the labor pool is important. The more knowledgeable, skilled, motivated, and able to learn members of the labor pool are, the better.
Well-educated, well-trained, motivated members of the labor pool quickly become productive employees when given jobs. Although providing ongoing training for employees is important in the age of global competitiveness, the type of training provided is important. Organizations that can offer training that has immediate and direct application spend less than those that have to begin by providing basic education for functionally illiterate employees. Since the 1970s, U.S. businesses have had to devote increasing amounts of money to basic education efforts, whereas foreign competitors have been able to provide advanced training that very quickly translates into better quality and productivity.
Many factors account for this difference. Some of these can be traced directly to the family. If the family unit, regardless of how it is constituted, is the nation’s most important human resource development agency, the labor pool from which U.S. companies must draw their employees cannot match that in competing countries.
Single parents who must work full-time have little or no time to help their children excel in school. Children with parents who do not value education are unlikely to value it themselves. If the family has a strong influence—positive or negative, by design or by default—on the attitudes of children toward learning and work, the United States faces deep- seated problems that must be solved if its companies are going to compete in the global marketplace.
4.3. Education-Related Factors
The transition from classroom to workplace has never been easy, but in the age of global competition it has only become more difficult. The needs of employers have increased markedly. Unfortunately, the academic performance of students in the United States has not kept pace with changes in the global marketplace. High school graduation rates in the United States rank near the bottom when compared with those in other leading industrialized nations—nations that America must compete with. In addition, the performance of those students who do graduate from high school is markedly lower than that of their contemporaries in competing industrialized countries.
On international tests of academic performance in such key areas as reading, mathematics, science, and problem solving, American students lag well behind their contemporaries in other countries. This is bad news for employers in the United States that must compete in an increasingly global environment. Human performance is one of the key ingredients in quality, productivity, value, organizational excellence, and all of the other factors that affect global competitiveness. Students who enter the workplace unable to perform at competitive levels in reading, mathematics, science, and problem solving just handicap their employers.
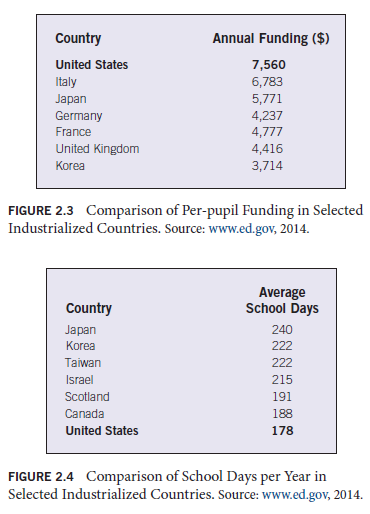
Figure 2.3 compares annual expenditures per pupil for leading industrialized countries. Of the top seven, the United States spends the most, whereas Korea spends the least. Figure 2.4 compares the number of school days required of students annually in the leading industrialized countries. With this criterion, the order is reversed when comparing the United States and Japan.
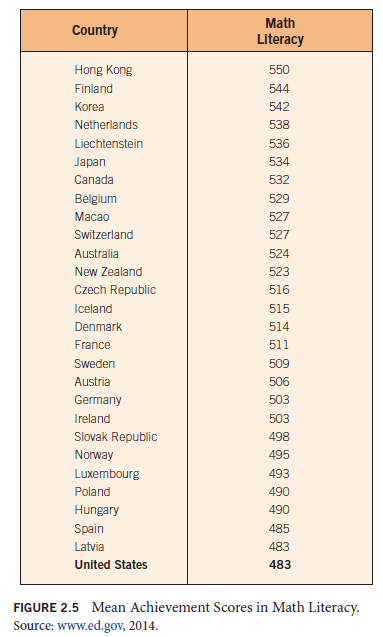
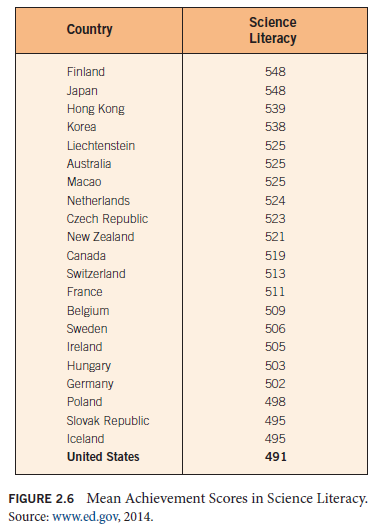
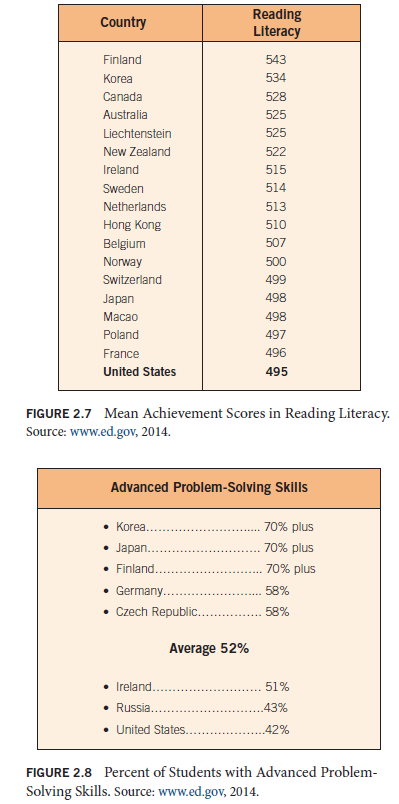
Figures 2.5, 2.6, 2.7, and 2.8 show the actual rankings of student performance on international tests of reading, mathematics, science, and problem solving as tracked by the Organization for Economic Cooperation and Development (OECD). Figure 2.5 shows the relative performance rankings of students in mathematics literacy. The average score of students from the United States is well below the international average (483 versus 498). Figure 2.6 shows similar results in science literacy. Figure 2.7 shows that students from the United States scored an average of 495 on reading while the average international score was 500. These scores do not bode well for the United States or for its employers who must compete in the global arena. In fact, what the scores mean is that if global competition were a footrace, the United States would be starting 100 yards behind in a 200-yard race.
5. U.S. Manufacturers and Global Competition
The most important sectors in determining the quality of life in a country are manufacturing and agriculture. The United States has led the world in agricultural production for many years and still does. The United States also led the world in manufacturing productivity for many years. Beginning with the 1960s, however, this lead began to slip. The decline continued and accelerated through the 1980s to the point that the U.S. manufacturing sector entered the 1990s struggling uphill to regain ground. In the mid- 1990s, however, the United States began to reemerge as a world-class competitor. No longer is the United States, or any other country, the clear-cut leader in terms of manufacturing productivity. With the dawning of the new millennium, Japan, the United States, Germany, and Korea became increasingly competitive.
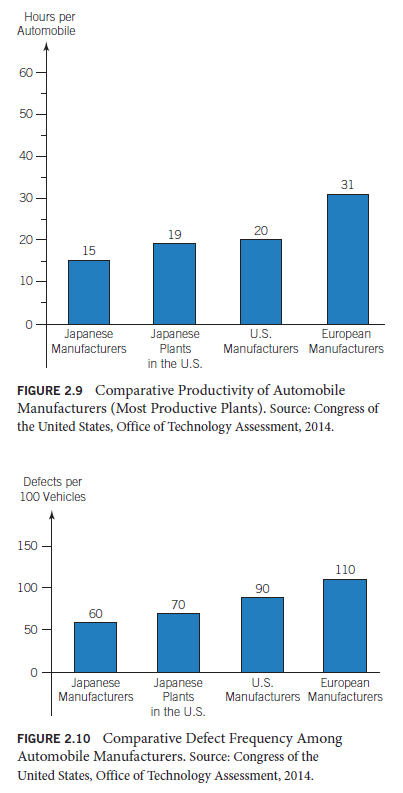
Figure 2.9 compares the productivity of automobile manufacturers in Japan, the United States, and Europe. In this chapter, the term productivity is used several times. In this context, the term should be viewed as “total factor productivity” (ratio of outputs to inputs from labor, capital, materials, and energy). The graph compares the average hours required by the most productive plants to produce one automobile. Japanese plants located in Japan are able to produce an automobile in an average of 15 hours. European manufacturers require more than twice that much time. Such U.S. manufacturers as General Motors, Ford, and Chrysler require an average of 20 hours per automobile. Japanese manufacturers with assembly plants in the United States using U.S. workers, such as Mazda, average 19 hours per automobile. Because hourly wages in Europe tend to be higher than those in Japan and the United States, European firms operate at a double competitive disadvantage. European and U.S. firms are nibbling away at these productivity differences to the point that the gap between the best and worst producers is slowly but steadily closing.
Another area in which Japanese firms have gained a competitive advantage is product development. The product development cycle—the time it takes to turn an idea into a finished product—is typically shorter in Japan than in the United States and Europe. This allows Japanese firms to get new products to the market faster. Japanese automobile manufacturers take an average of two years to complete the product development cycle compared with more than three years for their competitors in the United States and Europe.
Another basis for comparison among automobile manufacturers is quality. Productivity gained at the expense of quality yields no competitive advantage. Figure 2.10 compares the major automobile-producing nations in terms of the average number of defects per 100 vehicles manufactured. The quality comparisons follow the same trends found in the earlier productivity comparisons. Japanese manufacturers average the fewest defects; European manufacturers average the most. American manufacturers find it difficult to compete in the global marketplace when their productivity and quality are not up to international standards—a situation that must be reversed if the United States is to regain the preeminent position it has historically enjoyed in the world community.
Even a cursory examination of key economic indicators raises concerns. The ability of a country to compete in the manufacturing arena is a direct determinant of its quality of life. Manufacturing created the great American middle class. If the manufacturing sector dwindles because it cannot compete globally, the middle class dwindles correspondingly. Figure 2.11 contains a number of facts that indicate what has happened to the U.S. economy during the years since World War II. These are the years in which U.S. manufacturers have steadily lost ground to foreign competition.
Do these comparisons mean that U.S. manufacturers cannot compete? The answer is no. American manufacturers were slow to respond to the international quality revolution.

However, in the 1980s and into the new millennium, the realization that quality coupled with productivity was the key to winning global competition caused many U.S. firms to begin adopting the approach set forth in this book while s imultaneously pushing for change in areas beyond their control (cost of capital, industrial policy, etc.). As the total quality approach continues to gain acceptance, companies in the United States are closing the competitiveness gap.
6. COMPARISONS OF INTERNATIONAL COMPETITORS
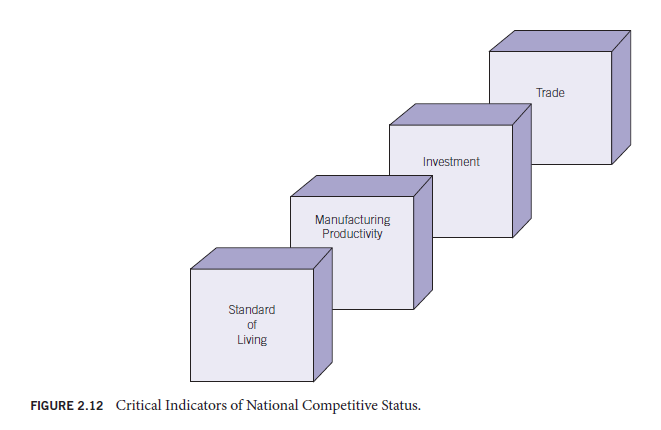
According to a report published by the World Economic Forum, the United States has reclaimed its place as the most competitive country in the world community.3 This is good news, since the United States had slipped to fifth place during the 1990s. This means that in spite of the poor performance of students in the United States when compared with the performance of students in other industrialized nations, the United States has managed to improve in the areas of standard of living, manufacturing productivity, investment, and trade, which are critical indicators of national competitive status (Figure 2.12).
7. HUMAN RESOURCES AND COMPETITIVENESS
The point is made continually throughout this book that the most valuable resources for enhancing competitiveness are human resources. The truth of this point becomes apparent if one studies the approach taken by Germany and Japan to rebuild from the rubble of World War II. Both countries were devastated. Being left with only one real resource, the human resource, Germany and Japan were forced to adopt an approach that used this resource to the greatest possible advantage.
The German and Japanese systems are not perfect, nor are they infallible. They are examples of approaches that work as well as any other two systems can in a continually changing and unsure global marketplace. Further, they make wise and effective use of human resources.
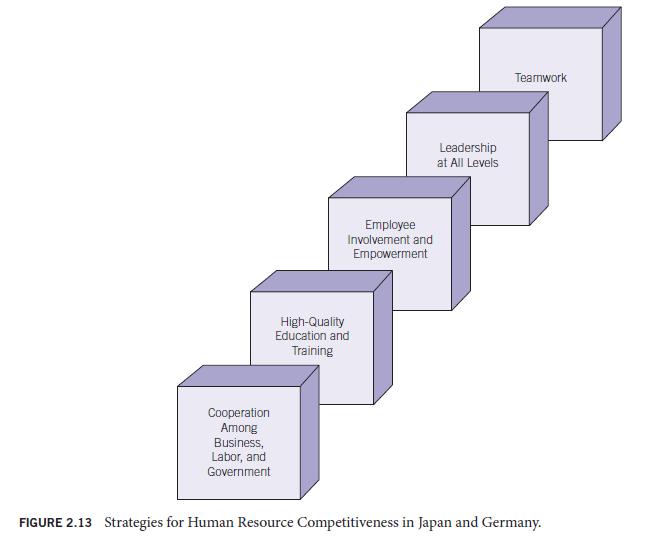
Business, government, and labor leaders in the United States could learn a great deal from Germany and Japan. People often respond to suggestions that such study might be helpful by claiming that the culture of the United States is so different that what works in these countries won’t work in the United States. Such thinking misses the point entirely: few countries could be more different from one another than Japan and Germany, yet the approaches to competitiveness adopted by these countries are strikingly similar (see Figure 2.13).
Source: Goetsch David L., Davis Stanley B. (2016), Quality Management for organizational excellence introduction to total Quality, Pearson; 8th edition.
What’s Going down i am new to this, I stumbled upon this I’ve discovered It absolutely helpful and it has helped me out loads. I am hoping to contribute & aid different customers like its aided me. Great job.