Various models are available which help to identify the ideal location. Some of the popular models are:
- Factor rating method
- Weighted factor rating method
- Load-distance method
- Centre of gravity method
- Break even analysis
1. Factor Rating Method
The process of selecting a new facility location involves a series of following steps:
- Identify the important location factors.
- Rate each factor according to its relative importance, e., higher the ratings is indicative of prominent factor.
- Assign each location according to the merits of the location for each factor.
- Calculate the rating for each location by multiplying factor assigned to each location with basic factors considered.
- Find the sum of product calculated for each factor and select best location having highest total score.
ILLUSTRATION 1: Let us assume that a new medical facility, Health-care, is to be located in Delhi. The location factors, factor rating and scores for two potential sites are shown in the following table. Which is the best location based on factor rating method?

The total score for location 2 is higher than that of location 1. Hence location 2, is the best choice.
2. Weighted Factor Rating Method
In this method to merge quantitative and qualitative factors, factors are assigned weights based on relative importance and weightage score for each site using a preference matrix is calculated. The site with the highest weighted score is selected as the best choice.
ILLUSTRATION 2: Let us assume that a new medical facility, Health-care, is to be located in Delhi. The location factors, weights, and scores (1 = poor, 5 = excellent) for two potential sites are shown in the following table. What is the weighted score for these sites? Which is the best location?

SOLUTION: The weighted score for this particular site is calculated by multiplying each factor’s weight by its score and adding the results:
Weighed score location 1 = 25 x 3 + 25 x 4 + 25 x 3 + 15 x 1 + 10 x 5
= 75 + 100 + 75 + 15 + 50 = 315
Weighed score location 2 = 25 x 5 + 25 x 3 + 25 x 3 + 15 x 2 + 10 x 3
= 125 + 75 + 75 + 30 + 30 = 335
Location 2 is the best site based on total weighted scores.
3. Load-distance Method
The load-distance method is a mathematical model used to evaluate locations based on proximity factors. The objective is to select a location that minimizes the total weighted loads moving into and out of the facility. The distance between two points is expressed by assigning the points to grid coordinates on a map. An alternative approach is to use time rather than distance.
3.1. Distance Measures
Suppose that a new warehouse is to be located to serve Delhi. It will receive inbound shipments from several suppliers, including one in Ghaziabad. If the new warehouse were located at Gurgaon, what would be the distance between the two facilities? If shipments travel by truck, the distance depends on the highway system and the specific route taken. Computer software is available for calculating the actual mileage between any two locations in the same county. However, for load-distance method, a rough calculation that is either Euclidean or rectilinear distance measure may be used. Euclidean distance is the straight-line distance, or shortest possible path, between two points.

The point A on the grid represents the supplier’s location in Ghaziabad, and the point B represents the possible warehouse location at Gurgaon. The distance between points A and B is the length of the hypotenuse of a right triangle, or
![]()
Where
dAB = distance between points A and B
XA = x-coordinate of point A
Ya = y-coordinate of point A
XB = x-coordinate of point B
Yb = y-coordinate of point B
Rectilinear distance measures distance between two points with a series of 90° turns as city blocks. Essentially, this distance is the sum of the two dashed lines representing the base and side of the triangle in figure. The distance travelled in the x-direction is the absolute value of the difference in x-coordinates. Adding this result to the absolute value of the difference in the y-coordinates gives
DAB = |Xa – Xb| + |YA – Yb|
3.2. Calculating a Load-distance Score
Suppose that a firm planning a new location wants to select a site that minimizes the distances that loads, particularly the larger ones, must travel to and from the site. Depending on the industry, a load may be shipments from suppliers, between plants, or to customers, or it may be customers or employees travelling to or from the facility. The firm seeks to minimize its load- distance, generally by choosing a location so that large loads go short distances.
To calculate a load-distance for any potential location, we use either of the distance measures and simply multiply the loads flowing to and from the facility by the distances travelled. These loads may be expressed as tones or number of trips per week.
This calls for a practical example to appreciate the relevance of the concept. Let us visit a new Health-care facility, once again.
ILLUSTRATION 3: The new Health-care facility is targeted to serve seven census tracts in Delhi. The table given below shows the coordinates for the centre of each census tract, along with the projected populations, measured in thousands. Customers will travel from the seven census tract centres to the new facility when they need health-care. Two locations being considered for the new facility are at (5.5, 4.5) and (7, 2), which are the centres of census tracts C and F. Details of seven census tract centres, co-ordinate distances along with the population for each centre are given below. If we use the population as the loads and use rectilinear distance, which location is better in terms of its total load- distance score?

SOLUTION: Calculate the load-distance score for each location. Using the coordinates from the above table. Calculate the load-distance score for each tract.
Using the formula DAb = |XA – XB| + |YA – YB|

Summing the scores for all tracts gives a total load-distance score of 239 when the facility is located at (5.5, 4.5) versus a load-distance score of 168 at location (7, 2). Therefore, the location in census tract F is a better location.
4. Centre of Gravity
Centre of gravity is based primarily on cost considerations. This method can be used to assist managers in balancing cost and service objectives. The centre of gravity method takes into account the locations of plants and markets, the volume of goods moved, and transportation costs in arriving at the best location for a single intermediate warehouse.
The centre of gravity is defined to be the location that minimizes the weighted distance between the warehouse and its supply and distribution points, where the distance is weighted by the number of tones supplied or consumed. The first step in this procedure is to place the locations on a coordinate system. The origin of the coordinate system and scale used are arbitrary, just as long as the relative distances are correctly represented. This can be easily done by placing a grid over an ordinary map. The centre of gravity is determined by the formula.

where
Cx = x-coordinate of the centre of gravity
Cy = y-coordinate of the centre of gravity
Dix = x-coordinate of location i
Diy = y-coordinate of location i
ILLUSTRATION 4: The new Health-care facility is targeted to serve seven census tracts in Delhi. The table given below shows the coordinates for the centre of each census tract, along with the projected populations, measured in thousands. Customers will travel from the seven census tract centres to the new facility when they need healthcare. Two locations being considered for the new facility are at (5.5, 4.5) and (7, 2), which are the centres of census tracts C and F. Details of seven census tract centres, coordinate distances along with the population for each centre are given below. Find the target area’s centre of gravity for the Health-care medical facility.

SOLUTION: To calculate the centre of gravity, start with the following information, where population is given in thousands.

Next we find Cx and Cy.
Cx = 453.5/68 = 6.67
Cy = 205.5/68 = 3.02
The centre of gravity is (6.67, 3.02). Using the centre of gravity as starting point, managers can now search in its vicinity for the optimal location.
5. Break Even Analysis
Break even analysis implies that at some point in the operations, total revenue equals total cost. Break even analysis is concerned with finding the point at which revenues and costs agree exactly. It is called ‘Break-even Point’. The Fig. 2.3 portrays the Break Even Chart:
Break even point is the volume of output at which neither a profit is made nor a loss is incurred.
The Break Even Point (BEP) in units can be calculated by using the relation:

The Break Even Point (BEP) in Rs. can be calulated by using the relation:


Plotting the break even chart for each location can make economic comparisons of locations. This will be helpful in identifying the range of production volume over which location can be selected.
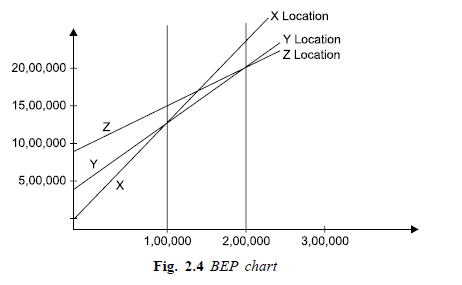
ILLUSTRATION 5: Potential locations X, Y and Z have the cost structures shown below. The ABC company has a demand of 1,30,000 units of a new product. Three potential locations X, Y and Z having following cost structures shown are available. Select which location is to be selected and also identify the volume ranges where each location is suited?

SOLUTION: Solve for the crossover between X and Y:
10X + 150,000 = 8X + 350,000
2X = 200,000
X = 100,000 units
Solve for the crossover between Y and Z:
8X + 350,000 = 6X + 950,000
2X = 600,000
X = 300,000 units
Therefore, at a volume of 1,30,000 units, Y is the appropriate strategy.
From the graph (Fig. 2.4) we can interpret that location X is suitable up to 100,000 units, location Y is suitable up to between 100,000 to 300,000 units and location Z is suitable if the demand is more than 300,000 units.
Source: KumarAnil, Suresh N. (2009), Production and operations management, New Age International Pvt Ltd; 2nd Ed. edition.
I don’t commonly comment but I gotta state regards for the post on this one : D.
Heya i am for the first time here. I came across this board and I find It really useful & it helped me out a lot. I hope to give something back and aid others like you aided me.