Stratification is a simple tool in spite of its name. It involves investigating the cause of a problem by grouping data into categories. This grouping is called stratification. The groups might include data relative to the environment, the people involved, the machine(s) used in the process, materials, and so on. Grouping data by common element or characteristic makes it easier to understand the data and to pull insights from them.

Consider an example from a factory floor. One of the factory’s products requires five assemblers, all doing the same thing at the same rate. Their output flows together for inspection. Inspection has found an unacceptably high rate of defects in the products. Management forms a team to investigate the problem with the objective of finding the cause and correcting it. They plot the data taken over the last month (see Figure 15.28).
The chart in Figure 15.28 plots all operator-induced defects for the month. The team believes that for this product, zero defects can be approached. If you were going to react to this chart alone, how would you deal with the problem? You have five assemblers. Do they all contribute defects equally? This is hardly ever the case. The data can be stratified by the operator to determine each individual’s defect performance. The charts in Figure 15.29 do this.
The five stratified charts in Figure 15.29 indicate that one operator, Assembler B, is responsible for more defects than the other four combined. Assembler A also makes more than twice as many errors as Assembler C or Assembler D and eight times as many as Assembler E, the best performer of the group.
The performance of Assembler A and Assembler B must be brought up to the level of the others. Possible causes of the operator-induced defects could be inherent skill, training, vision, attitude, attentiveness, and environmental factors, such as noise, lighting, and temperature in the operator’s workstation area. The charts provide an indication of the place to start making changes.
The Pareto charts of Figure 15.6 also represent stratification. Figure 15.6 started with a series of defect types that were the most costly (the first chart). Then it took the worst case, Miswires, and divided it into the kinds of miswires (the second chart). Then the worst kind, Hand Wrap, was split into several categories (the third chart). The dominant Hand-Wrap defect category was operator induced. Finally, the Operator category was stratified by individual operator (the fourth chart).
The power of stratification lies in the fact that if you stratify far enough, you will arrive at a root cause of the problem. Only when root causes are corrected will the problem be solved. Any other kind of solution is a work-around fix. Work-arounds are often used in the real world, but when they are, the underlying problem remains and will eventually cause disruption again.

In the present example, we probably did not go all the way to the root cause, unless Assembler B has serious mental, vision, or motor problems that could not be corrected.
The most likely root cause is that Assembler B has not been adequately trained for the job; something readily ascertained when the focus is on that individual. One or two more charts looking at the time of day when the mistakes are being made might yield some information, but once the problem is isolated to a person, discussion will usually take you quickly to the root cause. If, on the other hand, Assembler B is a robot and not a human (which is entirely possible in today’s automated environment), the stratification should go to at least one more level. We would have to determine the kinds of defects that Assembler B (the robot) is making. That may lead to adjustment or repair of the machine.
Figure 15.30 shows that the defects induced by this machine are almost all concerned with screws. The robot is either damaging the screws or breaking them off. Show this chart to the robot maintenance technician, and that person will immediately recognize that the robot needs an adjustment or replacement of its torque controller. The root cause of the problem is either misadjustment or a defective controller. The technician can confirm the diagnosis by running tests on the robot before certifying it for return to service.

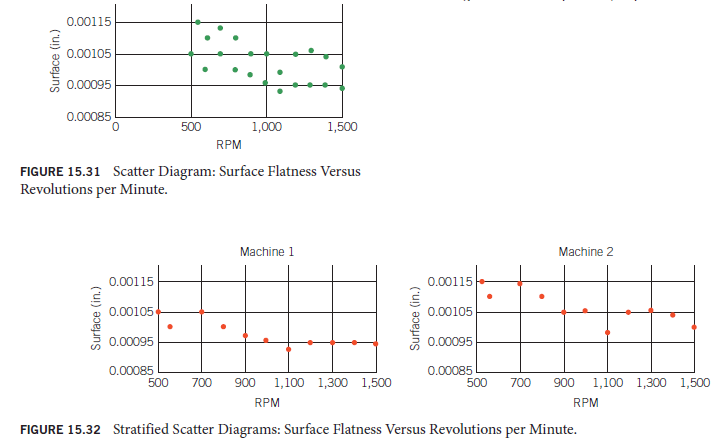
Data collected for Pareto charts and run charts (Figure 15.28) can be stratified. Virtually any data can be subjected to stratification. This includes the data collected for control charts, check sheets, histograms, and scatter diagrams. Consider an example of a stratified scatter diagram.
Scatter diagrams, which show the relationship between the x- and y-axes, lend themselves well to stratification. In this example, parts are being finished on two identical machines. A scatter diagram is plotted to correlate surface flatness and machine speed.
Figure 15.31 suggests that there is a correlation between machine speed (revolutions per minute, or rpm) and surface flatness between 500 and 1,000 rpm but no correlation at higher revolutions per minute. When the same data are stratified in the charts of Figure 15.32, the picture becomes clearer.
In Figure 15.32, the charts reveal that the two machines react similarly to speed increase, but Machine 1 is better than Machine 2 by about 0.00010 in its ability to produce a flat surface. The Machine 1 chart also suggests that increases beyond 1,000 rpm do not produce much improvement. A finish of 0.000950 is about as good as the machine will produce. On the other hand, the Machine 2 chart does show some improvement (two data points) past 1,300 rpm. Given the difference between the two machines, one message coming from the charts is that Machine 2 should be examined to determine the cause of its poorer performance. (More than likely it will be found that bearing wear is the factor in question, and that can be corrected easily.) After the machine has been repaired, new data should be taken to verify that 1,000 to 1,100 rpm is the best practical machine speed.
The charts in Figure 15.32 indicate another message. Both machines had data points better than normal at 550 and 1,100 rpm. It appears that the machines have a natural resonance that affects performance. The clue here is that both machines show it at 550 rpm and at double that speed (1,100 rpm). This should be checked out because it could be adversely affecting performance across the range. If vibration and resonance could be “quieted” across the operating range as it apparently is at 550 and 1,100 rpm, the performance might be significantly improved in both machines. The data that gave us this signal are in the scatter diagram of Figure 15.31, but they don’t jump out at you the way they do in the stratified charts of Figure 15.32.
In these examples, we have stratified assembly defects by operator, machine-induced defects by type of defect, and machine performance by machine. It was also pointed out that the earlier Pareto chart discussion involved stratification in which defects were stratified to types of defects, the worst of which was, in turn, stratified to the processes producing those defects. The process (Hand Wrap) producing the most defects was stratified to process factors, and, finally, the factor revealed as the most significant (Operator) was stratified to individual operators.
There is virtually no limit on the directions stratification can take. For example, the operators could have been stratified by age, training, gender, marital status, teams, experience, or other factors. The machines could have been stratified by age, date of maintenance, tools, and location (and in the case of similar but not identical machines, by make and model number). In similar fashion, operating procedures, environment, inspection, time, materials, and so on, can be introduced.
Source: Goetsch David L., Davis Stanley B. (2016), Quality Management for organizational excellence introduction to total Quality, Pearson; 8th edition.
It’s laborious to search out educated folks on this subject, however you sound like you understand what you’re speaking about! Thanks
Thanks for every other great article. The place else could anybody get that kind of information in such a perfect approach of writing? I’ve a presentation next week, and I am on the search for such info.