The Competitive Profile Matrix (CPM) identifies a firm’s major competitors and its particular strengths and weaknesses in relation to a sample firm’s strategic position. The weights and total weighted scores in both a CPM and an EFE have the same meaning. However, critical success factors in a CPM include both internal and external issues; therefore, the ratings refer to strengths and weaknesses, where 4 = major strength, 3 = minor strength, 2 = minor weakness, and 1 = major weakness. The critical success factors in a CPM are not grouped into opportunities and threats as they are in an EFE. In a CPM, the ratings and total weighted scores for rival firms can be compared to the sample firm. This comparative analysis provides important internal strategic information. Avoid assigning the same rating to firms included in your CPM analysis.
A sample CPM is provided in Table 3-12. In this example, the two most important factors to being successful in the industry are “advertising” and “global expansion,” as indicated by weights of 0.20. If there were no weight column in this analysis, note that each factor then would be equally important. Thus, having a weight column makes for a more robust analysis because it enables the analyst to assign higher and lower numbers to capture perceived or actual levels of importance. Note in Table 3-12 that Company 1 is strongest on “product quality,” as indicated by a rating of 4, whereas Company 2 is strongest on “advertising.” Overall, Company 1 is strongest, as indicated by the total weighted score of 3.15 and Company 3 is weakest.
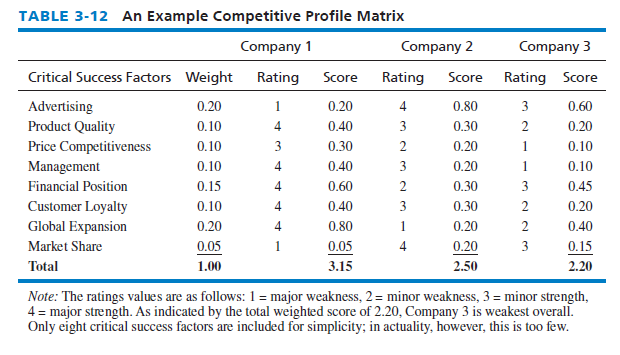
Other than the critical success factors listed in the sample CPM, factors often included in this analysis include breadth of product line, effectiveness of sales distribution, proprietary or patent advantages, location of facilities, production capacity and efficiency, experience, union relations, technological advantages, and e-commerce expertise.
Just because one firm receives a 3.20 overall rating and another receives a 2.80 in a CPM, it does not necessarily follow that the first firm is precisely 14.3 percent better than the second, but it does suggest that the first firm is better in some areas. Regarding weights in a CPM or EFE Matrix, be mindful that 0.08 is mathematically 33 percent higher than 0.06, so even small differences can reveal important perceptions regarding the relative importance of various factors. The aim with numbers is to assimilate and evaluate information in a meaningful way that aids in decision making.
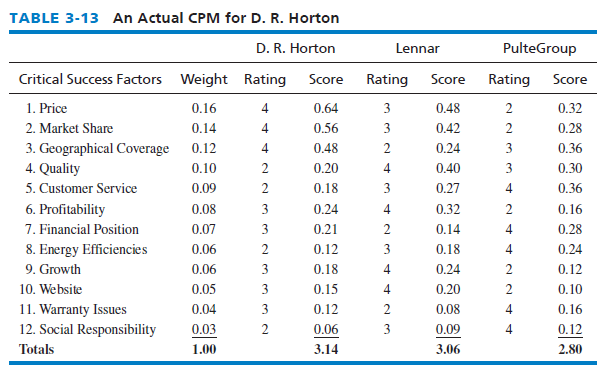
An actual CPM is provided in Table 3-13, again for the largest homebuilder in the United States, D. R. Horton. Note that the two rival firms, Lennar and PulteGroup, receive higher ratings on “Quality” than D. R. Horton. Also note the factors are listed beginning with the most important (highest weight). D. R. Horton, Lennar, and PulteGroup are headquartered in Fort Worth, Texas; Miami, Florida; and Atlanta, Georgia; respectively.
Source: David Fred, David Forest (2016), Strategic Management: A Competitive Advantage Approach, Concepts and Cases, Pearson (16th Edition).
17 May 2021
18 May 2021
17 May 2021
18 May 2021
17 May 2021
17 May 2021