Financial condition is often considered the single-best measure of a firm’s competitive position and overall attractiveness to investors. Determining an organization’s financial strengths and weaknesses is essential to effectively formulating strategies. A firm’s liquidity, leverage, working capital, profitability, asset utilization, cash flow, and equity can eliminate some strategies as being feasible alternatives. Financial factors often alter existing strategies and change implementation plans.
1. Finance/Accounting Functions
According to James Van Horne, the functions of finance/accounting comprise three decisions: the investment decision, the financing decision, and the dividend decision.24 Financial ratio analysis is the most widely used method for determining an organization’s strengths and weaknesses in the investment, financing, and dividend areas. Because the functional areas of business are so closely related, financial ratios can signal strengths or weaknesses in management, marketing, production, R&D, and MIS activities. Financial ratios are equally applicable in for-profit and nonprofit organizations. Even though nonprofit organizations obviously would not have return-on-investment or earnings-per-share ratios, they would routinely monitor many other special ratios. For example, a church would monitor the ratio of dollar contributions to the number of members, whereas a zoo would monitor dollar food sales to number of visitors. A university would monitor number of students divided by number of professors. Therefore, be creative when performing ratio analysis for nonprofit organizations, for they strive to be financially sound just as for-profit firms do. Nonprofit organizations need strategic planning just as much as for-profit firms.
The investment decision, also called capital budgeting, is the allocation and reallocation of capital and resources to projects, products, assets, and divisions of an organization. After strategies are formulated, capital budgeting decisions are required to successfully implement strategies. the financing decision determines the best capital structure for the firm and includes examining various methods by which the firm can raise capital (for example, by issuing stock, increasing debt, selling assets, or using a combination of these approaches). the financing decision must consider both short-term and long-term needs for working capital. Two key financial ratios that indicate whether a firm’s financing decisions have been effective are the debt-to-equity ratio and the debt-to-total-assets ratio.
Dividend decisions concern issues such as the percentage of earnings paid to stockholders, the stability of dividends paid over time, and the repurchase or issuance of stock. Dividend decisions determine the amount of funds that are retained in a firm compared to the amount paid out to stockholders. Three financial ratios that are helpful in evaluating a firm’s dividend decisions are the earnings-per-share ratio, the dividends-per-share ratio, and the price-earnings ratio.
The benefits of paying dividends to investors must be balanced against the benefits of internally retaining funds, and there is no set formula on how to balance this trade-off. In 2014-2016, companies are aggressively boosting their dividends paid to shareholders. Companies are also buying back their own stock (called Treasury stock) at record levels. For the reasons listed here, dividends are sometimes paid out even when the firm has incurred a negative annual net income, and/or even if the funds could be better reinvested in the business, and/or even if the firm has to obtain outside sources of capital to pay for the dividends:
- Paying cash dividends is customary for some firms. Failure to do so could be thought of as a stigma. A dividend change is a signal about the future.
- Dividends represent a sales point for investment bankers. Some institutional investors can buy only dividend-paying stocks.
- Shareholders often demand dividends, even in companies with great opportunities for reinvesting all available funds.
- A myth exists that paying dividends will result in a higher stock price.
2. Financial Ratios
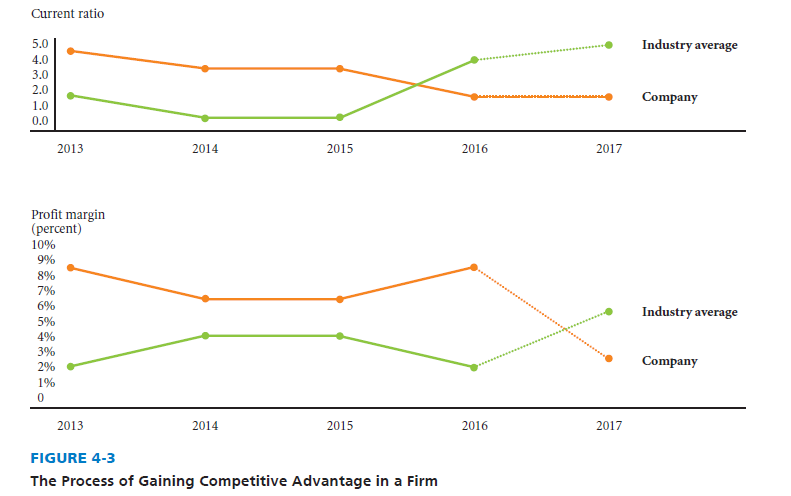
Financial ratios are computed from an organization’s income statement and balance sheet. Computing financial ratios is like taking a photograph—the results reflect a situation at just one point in time. Comparing ratios over time and to industry averages is more likely to result in meaningful statistics that can be used to identify and evaluate strengths and weaknesses. Trend analysis, illustrated in Figure 4-3, is a useful technique that incorporates both the time and industry average dimensions of financial ratios. Note that the dotted lines reveal projected ratios.
Financial ratio analysis should be conducted on three separate fronts: [1]
- How has each ratio changed over time? this information provides a means of evaluating historical trends. Examine whether each ratio has been historically increasing, decreasing, or nearly constant. For example, a 10 percent profit margin could be bad if the trend has been down 20 percent each of the last three years. But a 10 percent profit margin could be excellent if the trend has been up, up, up. Analysts often calculate the percentage change in a ratio from one year to the next to assess historical financial performance on that dimension. Large percent changes can be especially relevant.
- How does each ratio compare to industry norms? A firm’s inventory turnover ratio may appear impressive at first glance but may pale when compared to industry standards or norms. Industries can differ dramatically on certain ratios. For example, grocery companies have a high inventory turnover, whereas automobile dealerships have a lower turnover. Therefore, comparison of a firm’s ratios within its particular industry can be essential in determining strengths and weaknesses.
- How does each ratio compare with key competitors? Oftentimes competition is more intense between several competitors in a given industry or location than across all rival firms in the industry. When this is true, financial ratio analysis should include comparison to those key competitors. For example, if a firm’s profitability ratio is trending up over time and compares favorably to the industry average, but it is trending down relative to its leading competitor, there may be reason for concern.
Financial ratio analysis is not without some limitations. For example, financial ratios are based on accounting data, and firms differ in their treatment of such items as depreciation, inventory valuation, R&D expenditures, pension plan costs, mergers, and taxes. Also, seasonal factors can influence comparative ratios. Therefore, conformity to industry composite ratios does not establish with certainty that a firm is performing normally or that it is well managed. Likewise, departures from industry averages do not always indicate that a firm is doing especially well or badly. For example, a high inventory turnover ratio could indicate efficient inventory management and a strong working capital position, but it also could indicate a serious inventory shortage and a weak working capital position.
Another limitation of financial ratios in terms of including them as key internal factors in the upcoming IFE Matrix is that financial ratios are not very “actionable” in terms of revealing potential strategies needed (i.e., because they generally are based on performance of the overall firm). For example, to include as a key internal factor that the firm’s “current ratio increased from 1.8 to 2.1” is not as “actionable” as “the firm’s fragrance division revenues increased 18 percent in Africa in 2015.” Recall from the prior chapter the importance of selecting “actionable responses” as key factors, both externally and internally, upon which to formulate strategies. Selecting “actionable” key factors is vital to successful strategic planning.
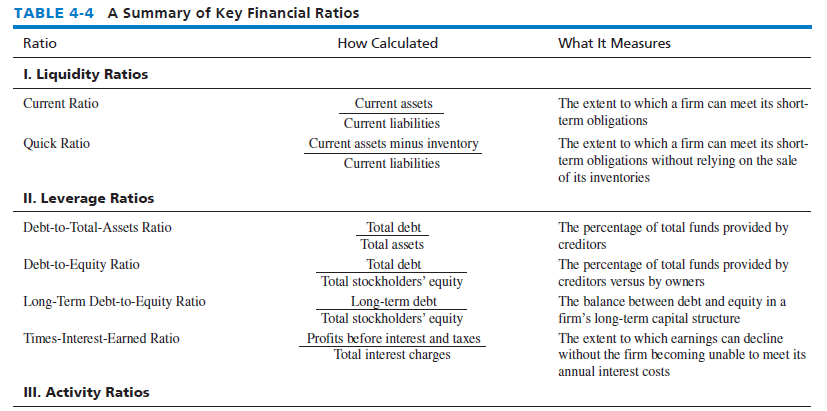
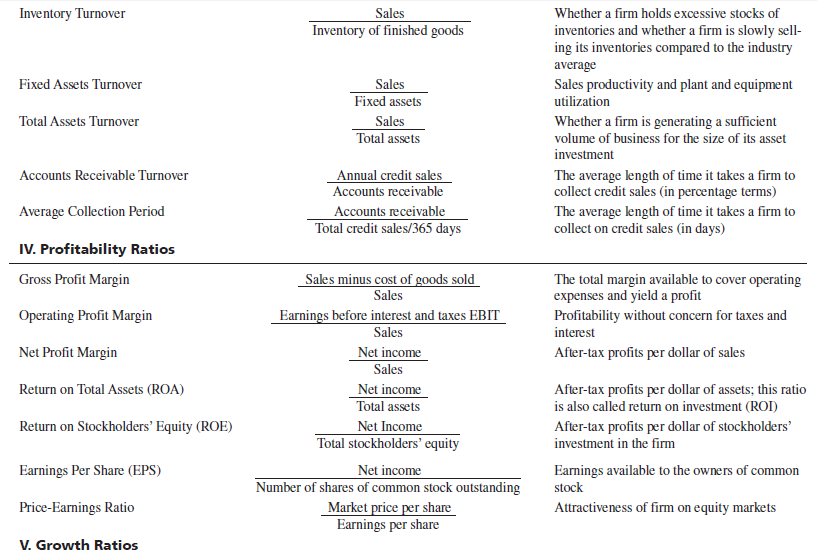
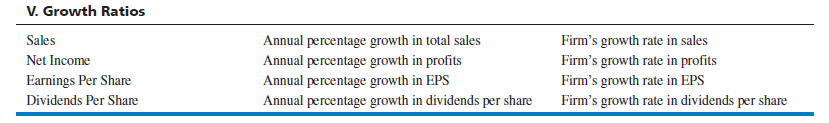
Table 4-4 provides a summary of key financial ratios showing how each ratio is calculated and what each ratio measures. However, all the ratios are not significant for all industries and companies. For example, accounts receivable turnover and average collection period are not meaningful to a company that takes only cash receipts. As indicated in Table 4-4, key financial ratios can be classified into the following five types: liquidity, leverage, activity, profitability, and growth.
3. Breakeven Analysis
Because consumers remain price sensitive, many firms have lowered prices to compete. As a firm lowers prices, its breakeven (BE) point in terms of units sold increases, as illustrated in Figure 4-4. The breakeven point can be defined as the quantity of units that a firm must sell for its total revenues (TR) to equal its total costs (TC). Note that the before and after chart in Figure 4-4 reveals that the TR line rotates to the right with a decrease in price, thus increasing the quantity (Q) that must be sold just to break even. Increasing the breakeven point is thus a huge drawback of lowering prices. Of course when rivals are lowering prices, a firm may have to lower prices anyway to compete. However, the breakeven concept should be kept in mind because it is so important, especially in recessionary times.
The before and after charts in Figure 4-5 show that increasing fixed costs (FC) raises a firm’s breakeven quantity. the figure also reveals that adding fixed costs such as more stores, or more plants, or even more advertising as part of a strategic plan also raises the TC line, which makes the intersection of the TC and TR lines at a point farther down the Quantity axis. Increasing a firm’s FC therefore significantly raises the quantity of goods that must be sold to break even. This is not just theory for the sake of theory. Firms with less fixed costs, such as Apple and Amazon.com, have lower breakeven points, which give them a decided competitive advantage in harsh economic times. Figure 4-5 reveals that adding fixed costs—such as plant, equipment, stores, advertising, and land—may be detrimental whenever there is doubt that significantly more units can be sold to offset those expenditures.
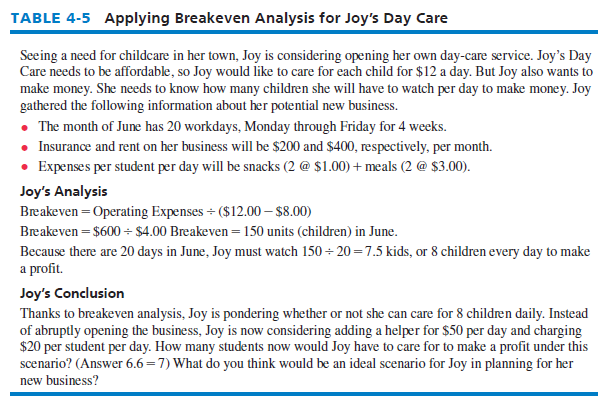
Firms must be cognizant of the fact that lowering prices and adding fixed costs could be a catastrophic double whammy because the firm’s breakeven quantity needed to be sold is increased dramatically. Figure 4-6 illustrates this double whammy. Note how far the breakeven point shifts with both a price decrease and an increase in fixed costs. If a firm does not break even, then it will of course incur losses, and losses are not good, especially sustained losses.
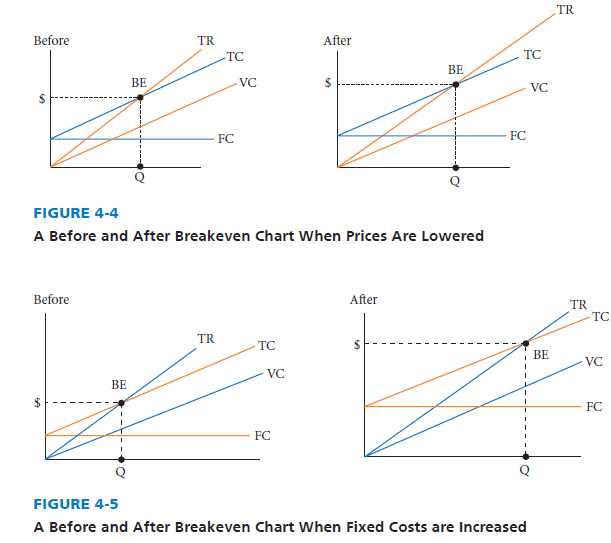
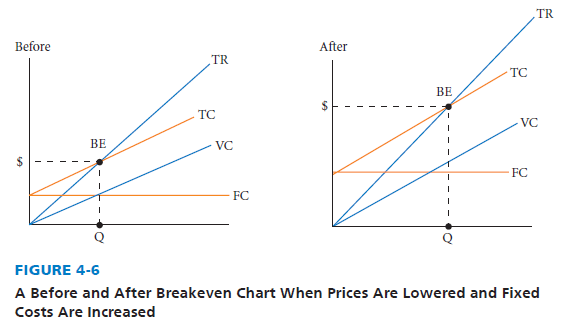
Finally, note in Figures 4-4, 4-5, and 4-6 that variable costs (VC), such as labor and materials, when increased, have the effect of raising the breakeven point, too. Raising VC is reflected by the VC line shifting left or becoming steeper. When the TR line remains constant, the effect of increasing VC is to increase TC, which increases the point at which TR = TC = BE.
The formula for calculating the breakeven point is BE Quantity = TFC divided by (price – VC). In other words, the quantity or units of product that need to be sold for a firm to break even given in Table 4-5. Suffice it to say here that various strategies can have dramatically beneficial or harmful effects on the firm’s financial condition because of the concept of breakeven analysis. There are some limitations of breakeven analysis, including the following points:
- Breakeven analysis is only a supply side (i.e., costs only) analysis because it reveals nothing about what sales are likely to be for the product at various prices.
- It assumes that fixed costs are constant. Although this is true in the short run, an increase in the scale of production will cause fixed costs to rise.
- It assumes average variable costs are constant per unit of output, at least in the range of likely quantities of sales.
- It assumes that the quantity of goods produced is equal to the quantity of goods sold (i.e., there is no change in beginning or ending inventory).
- In multiproduct companies, it assumes that the relative proportions of each product sold and produced are constant (i.e., the sales mix is constant).
4. Finance/Accounting Audit Checklist
Some finance/accounting questions that should be examined in any strategic analysis of the firm are given here:
- Where is the firm financially strong and weak as indicated by financial ratio analyses?
- Can the firm raise needed short-term capital?
- Can the firm raise needed long-term capital through debt or equity?
- Does the firm have sufficient working capital?
- Are capital budgeting procedures effective?
- Are dividend payout policies reasonable?
- Does the firm have good relations with its investors and stockholders?
- Are the firm’s financial managers experienced and well trained?
- Is the firm’s debt situation excellent?
Source: David Fred, David Forest (2016), Strategic Management: A Competitive Advantage Approach, Concepts and Cases, Pearson (16th Edition).
You have mentioned very interesting details! ps nice web site.