We touched on Six Sigma in our discussion of histograms in Chapter 15. Now we must take a deeper look at this concept. In 1981, Robert Galvin, who was the president of Motorola, issued a challenge to his company: Improve performance tenfold over the next five years. Motorola responded and achieved the goal. That led the company to its next challenge. Galvin, by then versed in some work being done in Motorola’s Communications Sector with the goal of Six Sigma quality, called for 10 times improvement in each of the next two-year periods, and achieving Six Sigma quality throughout the corporation by 1992. That required a staggering 100 times improvement in all operations of the company. It was not achieved by 1992, but by that year it was clear that this was the right thing to do. By 1993, many of Motorola’s manufacturing operations were operating at or near Six Sigma.27
In the first ten years following Galvin’s Six Sigma challenge, and as a direct result of the Six Sigma efforts, Motorola claimed to have saved several billions of dollars which went directly to the bottom line as profit. Sales increased by a factor of five, and profits increased by nearly 20% each year.28 Other companies that have adopted Six Sigma report similar gains.
As the word of Six Sigma spread, other organizations took up the challenge. CEO Jack Welch committed General Electric to Six Sigma (1995). Allied Signal (1994) and Honeywell (1998)—the two now combined under the name of Honeywell International Inc.—were other very large companies that took on Six Sigma. They were soon followed by Ford (2000) and a host of others. In the second decade of the twenty-first century, rooted in total quality management, Six Sigma enjoys widespread application across many industrial and service sectors. Applicability of Six Sigma is not limited to manufacturing concerns. Albertsons and parent supermarket chain Supervalu figure their Six Sigma savings from 2002 through 2008 in the hundreds of millions of dollars.29 Six Sigma is even finding application in the military. In 2008, the U.S. Army recorded savings of $2 billion from four Six Sigma initiatives involving such disparate projects as
- More efficient meal scheduling
- Streamlining communications through the chain of command
- Reducing the recruiting process from 32 steps to 11
- Better management of clothing outlet inventory
Six Sigma is one of the most innovative developments to emerge out of the total quality movement. Its purpose is to improve processes to the point where the defect rate is 3.4 per million or less, thereby making the company more competitive, profitable, and successful. Originally designed for use in high- volume production settings, it has nonetheless been found equally suited to service organizations, including the military, hospitality industry, supermarkets, and so on. Its benefits include the following: cost reduction, productivity improvement, market-share growth, customer retention, cycle-time reduction, culture change, and product/service development.30
Modern products and services have many built-in opportunities for defects. In manufacturing, for example, most good companies try to operate in the 3-sigma to 4-sigma region. The number of defects from such a company will range between 63 and 2,700 defects per million. The Six Sigma companies expect just 3.4 defects per million.
Motorola won the Malcolm Baldrige National Quality Award in 1988 for its pioneering efforts in the development of the Six Sigma concept. The central core of the Six Sigma concept is a six-step protocol for process improvement, which are as follows:
- Identify the pro duct characteristics wanted by customers.
- Classify the characteristics in terms of their criticality.
- Determine if the classified characteristics are controlled by part and/or process.
- Determine the maximum allowable tolerance for each classified characteristic.
- Determine the process variation for each classified characteristic.
- Change the design of the product, process, or both to achieve a Six Sigma process performance.
It is important to note that the Six Sigma concept is a subset of the broader concept of total quality. Six Sigma is a strategy within the context of total quality that moves the target to a much higher level of quality than organizations have achieved in the past. It is not a concept that supplants or replaces total quality. Rather, it is an innovative way to pursue a higher level of quality under the broad umbrella of total quality.
1. Six Sigma Belts, Champions, and Executives
Unlike total quality management (TQM), the Toyota Production System and Lean, Six Sigma has a defined organizational hierarchy of Six Sigma expertise and experience for the organization implementing practices and operating Six Sigma projects. These hierarchical levels are named as follows:
- Executive (CEO, Top Management). Establish Six Sigma vision for the organization. Empower subordinate Six Sigma leaders. Provide necessary resources for the implementation/projects.
- Champion. Trained in Six Sigma methodology and selection of Six Sigma projects that are aligned with business objectives. Executive designates Champions from upper management to identify Six Sigma projects, align and integrate them with the organization’s goals and vision. Select and mentor Six Sigma project leader “Belts.”
- Master Black Belt. Identified by Champions to be cross-functional in-house Six Sigma consultants/ facilitators/coaches. Assist Champions in identification of Six Sigma projects. Has extensive project management experience, and thorough mastery of Six Sigma methodology and tools. Guides and mentors Black and Green Belts. Usually full-time Six Sigma employees.
- Black Belt. Has significant Six Sigma training. Primarily engaged in leading Six Sigma project execution under the Master Black Belts.
- Green Belt. Has Six Sigma training. Project leaders engaged in Six Sigma implementation/projects, operating under guidance from the Black Belts.
If this sounds like a martial arts system, it is for a good reason. In the early days of Six Sigma the folks who were involved in implementation of the practices or execution of the projects needed the aura of authority (and maybe with some intimidation thrown in) carried by a martial arts Black Belt. Motorola could have simply set up the same certification levels, calling them Level 1, Level 2, or Master, Journeyman, and so on, but the Belt nomenclature had a more dynamic ring to it, and it has endured. Although there is no central clearing house for Six Sigma certification, Motorola, the American Society for Quality, the Institute of Industrial Engineers, and many other organizations offer individuals Six Sigma certification.
2. Key Personnel Preparation and Roles in Six Sigma
One of the strengths of Six Sigma is its emphasis on preparation of the key personnel who will be responsible for its deployment and ongoing operation. This preparation, coupled with well-defined roles for personnel, adds to the potential of this continual improvement method. Advocates of Six Sigma take a four-pronged approach to deploying the concept: (1) understand the concept and all of its component elements, (2) train key personnel who will be the organization’s Green and Black Belts, (3) make sure that the organization’s Green and Black Belts are provided the environment needed for success by key decision makers who serve as Champions of the Six Sigma deployment, and (4) provide Master Black Belts to support, guide, instruct, mentor, and assist the Black Belts.
Green Belts are selected personnel in an organization who have completed basic training in the application of DMAIC Roadmap and the various tools associated with it. Black Belts have completed more advanced training in the application of DMAIC and the associated tools. Master Black Belts are Black Belts who have shown themselves to be selfreliant, self-motivated, and excellent problem solvers and who, as a result, have been allowed to complete additional training. Master Black Belts, as a result of their additional training, have a broader array of tools to apply in solving problems. These additional tools become especially important when an improvement project being run by a Black Belt becomes bogged down or hits a roadblock.
Champions, in the long run, represent the most important component in the deployment of Six Sigma. Champions, as the name implies, are key decision makers in an organization who “champion” the cause of effective Six Sigma deployment. They provide an environment in which Six Sigma can be effectively employed. They support the concept and those tasked with applying it. When problems arise between a Black Belt and anyone else in the organization, Champions step in to defuse the situation before it throws the Six Sigma deployment off track. This is especially important when a Black Belt faces resistance from a manager who is higher in the organization.
Effective Champions must have the skills of a diplomat and a green beret—and they must know when to employ which. In addition, Champions must be proficient in: (1) business and operations interface, (2) project selection, (3) pace mediation, and (4) results implementation.
3. DMAIC Roadmap
The nucleus of Six Sigma is the Define, Measure, Analyze, Improve, and Control or DMAIC Roadmap. Although the five phases of the roadmap concept are constant, the steps, tools, and outputs of each phase can vary slightly, depending on the type of organization and the exigencies of that organization. An excellent model of a DMAIC Roadmap for Six Sigma was developed by Sigma Breakthrough Technologies Inc. The explanations in the remainder of this section are based on this model roadmap.31 For each phase, there are steps, associated tools, and outputs. The steps and outputs are summarized in the following paragraphs, along with a sampling of some of the tools that might be used.
Define In this phase of the roadmap, users (1) initiate the project, (2) define the process, (3) determine customer requirements, and (4) define key process output variables. These steps lead to the following outputs: the project charter, the project team, and a list of clear customer requirements. Some of the tools that might be used in this phase include SIPOC maps (see Figure 19.12), value stream maps, affinity diagrams, brainstorming, Murphy’s Analysis, customer requirement trees, and surveys.
Measure In this phase, users (1) understand the process, (2) evaluate risks on process inputs, (3) develop and evaluate measurement systems, and (4) measure current performance. These steps result in the following outputs: current state process maps, identified and measured Xs or Key Process Input Variables (KPIVs), verification of measurement systems, and current capability of Ys or Key Process Output Variables (KPOVs). Some of the tools that might be used in this phase include SIPOC/Value Stream Mapping, input/output analysis, detailed process maps, FMEA, data collection plans, data integrity audits, and C&E matrices.
Analyze In this phase, users (1) analyze data to prioritize key input variables and (2) identify waste. These steps result in the following outputs: root causes of defects that are reduced to the vital few, a prioritized list of potential key inputs, and a list of specific wastes. Some of the tools that might be used in this phase include statistical process control (SPC), T-tests, analysis of variance (ANOVA), nonparamet- rics, chi square regression, Five-S, and multivariable studies.
Improve In this phase, users (1) verify critical outputs, (2) design improvements, and (3) pilot the new process. These steps result in the following outputs: a final list of KPIVs, an action plan for improvement, future state process maps, FMEA, control plans, new process design/documentation, and a pilot study plan. Some of the tools that might be used in this phase include design of experiments, kanban, mistakeproofing, quick changeover, process mapping, process documentation, training plans, SPC, FMEA, and control plans.
Control In this phase, users (1) finalize the control system and (2) verify long-term capability. These steps result in the following outputs: a control system, improvement validated for the long term, identified continual improvement opportunities, handoff of the new process, and team recognition. Some of the tools that might be used in this phase include control plans, process documentation, training plans, SPC, and process capability.

4. Six Sigma: The Name
The name Six Sigma comes from the concept of standard deviation, a statistically derived value represented by the lowercase Greek letter sigma (a). The variation of processes and their output products is typically measured in the number of standard deviations from the mean (usually the ideal point). (See the section on histograms in Chapter 15.)
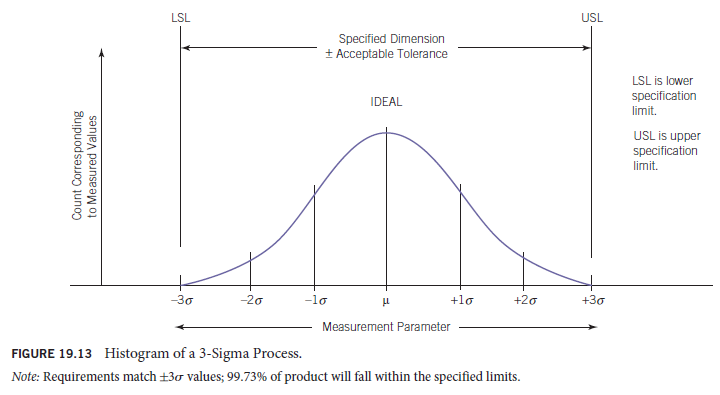
The well-controlled processes of most good companies presently operate between 3 and 4 sigma. This means 99.73% of the output of a process will fall between plus and minus three standard deviations at 3 sigma, or 99.9937% at 4 sigma. If the specification (such as a required dimension with a tolerance) for parts produced by the process should correspond to the ±3a values, then a 3-sigma process will yield 2,700 defective parts for every 1 million produced. (See Figure 19.13.)
Let’s assume that the specifications describing acceptable product remain constant and that through some i mprovement we are able to decrease process variation to the point that its new 6-sigma deviation corresponds to the positions of the old 3-sigma values. (See Figure 19.14.) Now if everything else remains constant, the process will yield 99.9999998% acceptable product, or a mere 0.002 defective parts per million. In this case, the process is performing at a 6-sigma level. Note that this corresponds to 1 unacceptable part in 500 million produced.

When Motorola embarked on its journey to break out of the normal quality level associated with 3- or 4-sigma processes, it targeted 6 sigma—hence the name Six Sigma. Eventually, other companies began to adopt the Motorola program, and the name has become part of the quality lexicon.
5. Relationship of Six Sigma to Total Quality
Six Sigma is an extension of total quality management, which has the aim of taking process and product quality to levels where all customer requirements are met. Depending on which Six Sigma proponent you are listening to, the emphasis may be on improving the bottom line or on meeting customer requirements. Of course, the latter is the best way to accomplish the former. It is important to understand that Six Sigma is not some new field of endeavor separate from the total quality philosophy. Quite the contrary, Six Sigma is a total quality strategy for achieving what all the other total quality strategies attempt to achieve: superior performance that is improved continually, forever.
6. How Is Six Sigma Achieved?
Six Sigma can be achieved by improving process performance, but improving processes to this degree can be difficult, and in many cases nearly impossible. On the other hand, Six Sigma can be achieved without improving the process at all if the specification describing acceptable product can be loosened enough to correspond to the original process’s ±6a points (see Figure 19.15). Note that in this case the process, which is identical to that of Figure 19.13, was not changed in any way. Instead, the definition of what is acceptable in terms of process input was changed. The specification range has been increased from the values corresponding to the ±3a points to the values corresponding to the ±6a points. When we do this, unacceptable product will occur only once in 500 million products.

In order to use this strategy, we must be able to use output that has greater deviation from the ideal value— without sacrificing performance, reliability, or other quality parameters. This is done through engineering processes called robust design and design for manufacture. Robust design seeks to design products that maintain their reliability, performance, and other quality characteristics even when the component parts of the whole product have great variability of important characteristics. The objective of design for manufacture is to eliminate the possibility of manufacturing errors by simplifying and “error-proofing” the steps required for manufacturing the product. These techniques—improving processes (both incrementally and in giant leaps) and rendering the processes more efficient and foolproof through the use of robust design and design for manufacture—have been around for a long time and are considered by most to be essential elements of TQM. The difference here is that Motorola did something no one else had done: It set the target at Six Sigma.
7. Is Six Sigma Really Six Sigma?
In this chapter’s discussion so far, we have used numbers relating to acceptable product that are quite different from those found in the Six Sigma literature. For example, at 3 sigma, out of 1 million chances for success, there will be 2,700 failures. That is a success rate of 99.73%. At 6 sigma, the prediction is that 0.002 failures will occur out of 1 million chances. That is a success rate of 99.9999998%. However, the most often seen number for failures out of 1 million chances in Six Sigma is 3.4. This is a significant difference. Statistics predict one failure in 500 million chances at 6 sigma. Motorola uses 3.4 out of 1 million or 1,700 times more failures than statistics project. Figure 19.16 illustrates the difference between straight statistics and the Motorola version.
Clearly, the numbers used by Motorola in its Six Sigma program are significantly different from those derived from straight statistics. Which are correct? The answer is that the straight statistics numbers are correct, but the Motorola numbers are better in a practical sense. What Motorola has done is applied a factor to account for slight changes in environmental conditions, different operators, and so on. The reason Motorola considers this valid is that the sigma values of any process are derived from a statistically valid sample of process operation, necessarily taken over a relatively short period of time. The typical histogram is a snapshot of what is going on at the time the data were collected. Should that period be changed from a few weeks to a few years, one would no doubt encounter new variations resulting from the environment, new operators, and other factors. Motorola believes that the short-term view provides an overly optimistic picture of process variation and, consequently, of the process results at a given sigma level. The company concluded, therefore, that the reality of the long term under which the processes operate should be compensated for. Motorola chose to do this by shifting the process average (f) from the target, or ideal point, by 1.5 sigma to the right, while leaving the normal 6 sigma field and the upper and lower specification limits as they were. (See Figure 19.17.)
Such a shift could take place due to environmental changes or other factors. Drifts and shifts of varying magnitude are the norm in the long term, and Motorola is covering that eventuality by accounting for it before the fact. The values for nonconformances per million opportunities (NPMO) are then taken from the right tail of the histogram. Notice in Figure 19.17 that the +3a point intercepts the shifted curve at the equivalent of its +1.5a. At 1.5 sigma, there should be 66,803 NPMO, which corresponds exactly with Motorola’s expectation for 3 sigma. Similarly, the +6a line intercepts the shifted curve at its +4%a point; 4.5 sigma is predicted by statistics to yield 3.4 NPMO, the value used in the Motorola Six Sigma program. Whether in real life the process should shift to the left or the right makes no difference, since the same results occur in either direction. Practically speaking, and pragmatically anticipated by Motorola, the process may shift back and forth by varying magnitudes over time. By introducing the 1.5 sigma shift, Motorola has allowed some long-term variation to enter the picture without causing panic.


We hasten to state that we do not disagree with the route Motorola took with the 1V sigma shift. Smart people determined that this was the appropriate thing to do. Still, we are not completely comfortable with the Six Sigma name if it fails to truly represent 6 sigma. But we will not argue with 3.4 nonconformances out of a million opportunities. This is a quality level that is so far beyond the average that we will gladly accept it, name and all.
Source: Goetsch David L., Davis Stanley B. (2016), Quality Management for organizational excellence introduction to total Quality, Pearson; 8th edition.
1 Jun 2021
1 Jun 2021
1 Jun 2021
1 Jun 2021
17 Jul 2021
17 Jul 2021