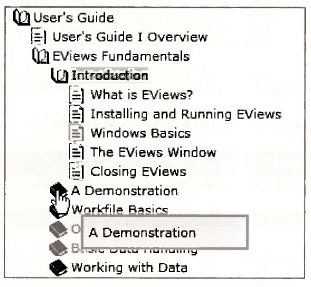
As noted earlier all the data for the book Principles of Econometrics is provided as EViews worhfiles. These will be used starting in Chapter 2. To illustrate the basic functioning of EViews we will use an example provided with EViews. Click on Help/EViews Help Topics/User’s Guide/EViews Fundamentals/A Demonstration.
The demonstration starts by importing data into EViews from an Excel spreadsheet. We will skip that step here, but if you like you can gain further practice by following along their demonstration.
Remark: You will want to be able to “import” data into EViews, or enter data manually. We cover the various methods for entering data into EViews in Chapter 17 of this manual.
1. Setting the default path
At the bottom of the EViews screen you will see Path = . This determines where EViews will first look for data and save workfiles.
![]()
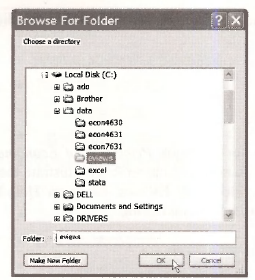
Double-click on Path and a window will open in which you can locate what you desire for your default directory. We will use the path c:\data\eviews
2. Opening a workfile
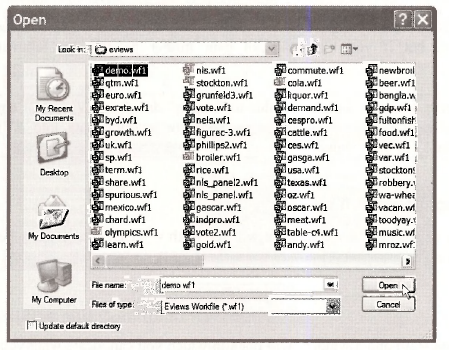
Open the workfile called demo by clicking File/Open/Workfile
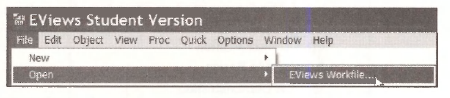
Select demo.wfl and click on Open.
The workfile opens to show
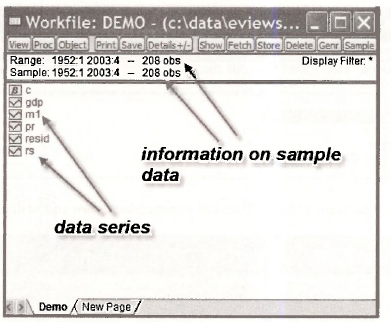
Located on the left side are data series that are indicated by the icon 0. EViews calls the elements of the workfile objects. As you will discover, there are many types of objects that EViews can save into the workfile—not only series but tables, graphs, equations, and so on. As Richard Startz says, an object is a little “thingie” that computer programmers talk about. Each little icon “thingie” in the workfile is an object.
In this workfile the data series, or variables, are:
- GDP—gross domestic product
- Ml—money supply
- PR—price level (index)
- RS—short term interest rate
The series resid and the icon labeled p are always present in EViews workfiles (even new ones with no data) and their use will be explained later. Across the top of the workfile are various buttons that initiate tasks in EViews, and these too will be explained later.
Below the buttons are Range: 1952:1 2003:4, which indicates that the 208 observations on the variables included run from 1952, Quarter 1, to 2003, Quarter 4. Sample: 1952:1 2003:4 denotes the data observations EViews will use in calculations. Many times we will choose for analysis less than the full range of observations that are available, so Sample will differ from Range.
3. Examing a single series
It is a good idea each time you open a workfile to look at one or more series just to verify that the data are what you expect. First, select one series
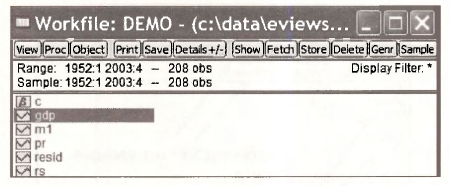
Double-click in the blue area, which will reveal a spreadsheet view of the data.
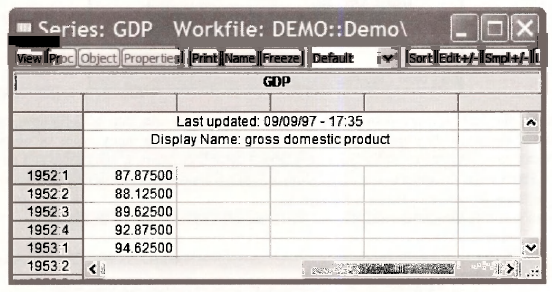
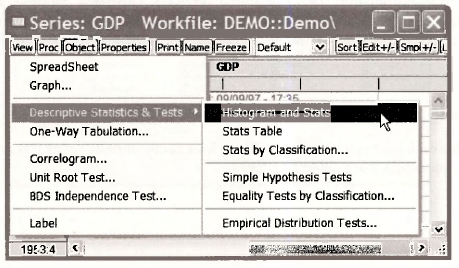
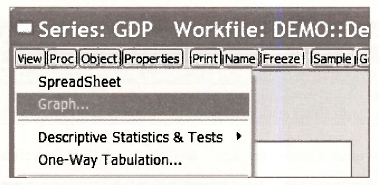
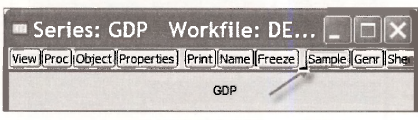
In the upper left hand corner is a button labeled View
![]()
This opens a drop-down menu with a number of choices. Select Descriptive Statistics & Tests/Histogram and Stats.
The result is
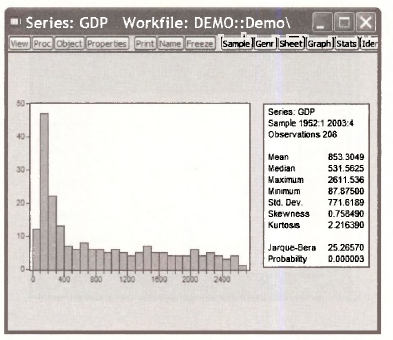
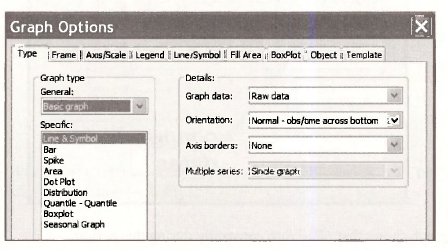
This histogram is shown with various summary statistics on the side. Click on View again. Select Graph.
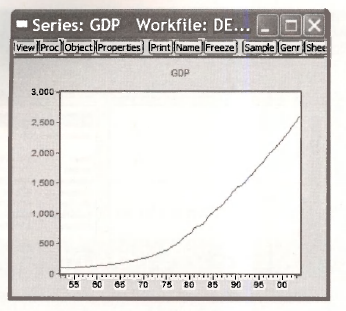
There you will see many options. The default graph type is a Basic Graph with the Line & Symbol plotted. Select OK.
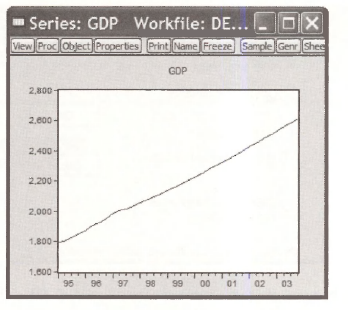
The result is a line graph. The dates are on the horizontal axis and GDP on the vertical axis.
4. Changing the sample
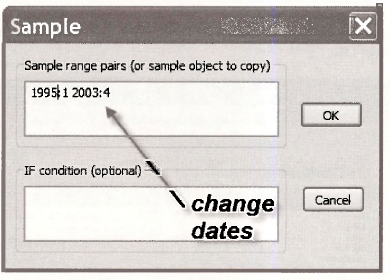
If you wish to view the graph or summary statistics for a different sample period, click on the Sample button. This feature works the same in all EViews windows.
In the dialog box that opens change the sample to 1995:1 to 2003:4 then click OK.
The resulting graph shows that GDP rose constantly during this period.
5. Copying graph into a document
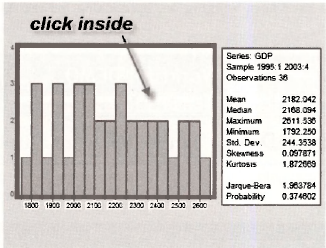
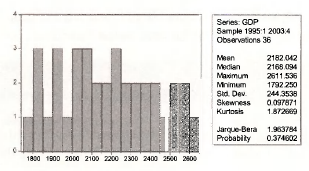
Select View/Descriptive Statistics & Tests/Histogram and Stats. You will find now the summary statistics and histogram of GDP for the period 1995:1 to 2003:4. These results can be printed by selecting the Print button.
![]()
You may prefer to copy the results into a word processor for later editing and combining results. How can results be taken from EViews into a document? Click inside the histogram
While holding down the Ctrl key press C (which we will denote as Ctrl+C). This is the Windows keystroke combination for Copy.
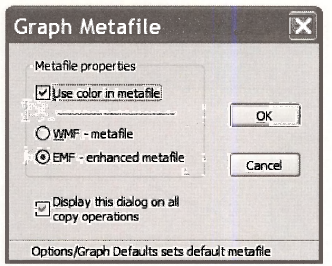
In the resulting dialog box you can make some choices, then click OK. This copies the graph into the Windows clipboard (memory). Open a document in your word processor and enter Ctrl+V which will Paste the figure into your document.
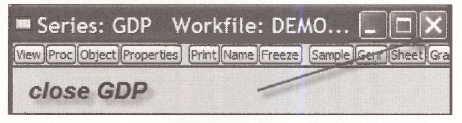
Lets close the graph we have been working on, by clicking the red X in the upper right hand comer of the GDP screen
Source: Griffiths William E., Hill R. Carter, Lim Mark Andrew (2008), Using EViews for Principles of Econometrics, John Wiley & Sons; 3rd Edition.
Hi there, just wanted to mention, I liked this article.
It was helpful. Keep on posting!