The spreadsheet view of the data is very powerful. Another key tool is the Quick menu on the EViews workfile menu.

The options shown are
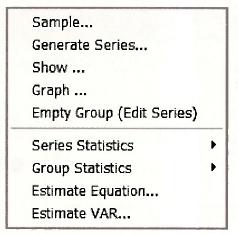
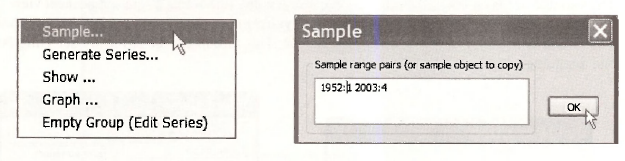
1. Changing the sample
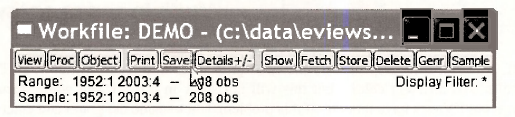
By selecting Sample from this menu we can change the range of sample observations. Change the sample to 1952:1 to 2003:4 and click OK.
2. Generating a new series
In each problem we may wish to create new series from the existing series. For example, we can create the natural logarithm of the series Ml. Select Quick/Generate Series. In the resulting dialog box type in the equation log_m1=log(m1), then click OK. A new series will appear in the workfde. The function log creates the natural logarithm. All logarithms use in Principles of Econometrics are natural logs.
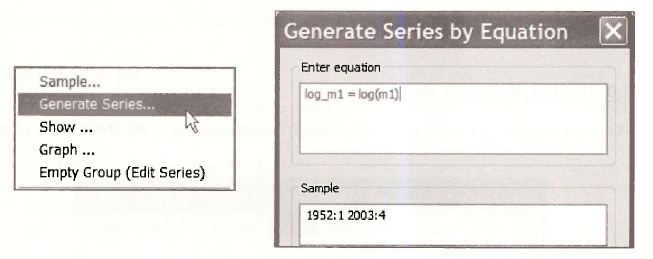
Alternatively, we can generate a new series by selecting the Genr button on the workfile menu. This will open the same Generate Series dialog box.
3. Plotting using Quick/Graph
We can create graphs from the spreadsheet view, but we can also use Quick/Graph.
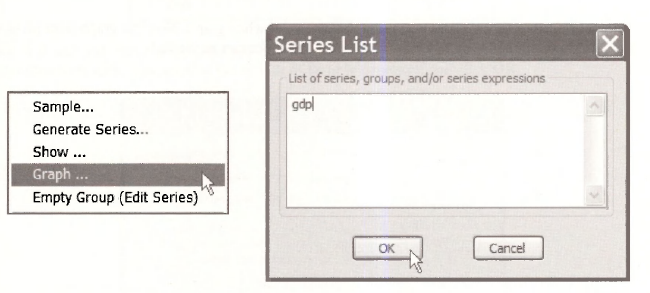
This will open the Graph options window. For a basic graph click OK.
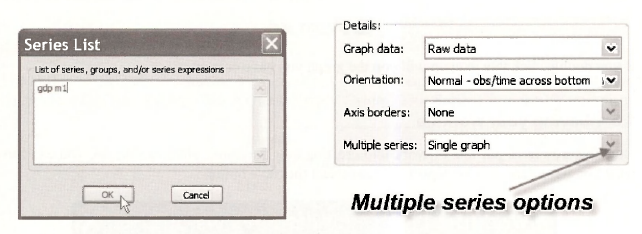
If you enter two series into the Series List window then the Graph options window will have an additional option
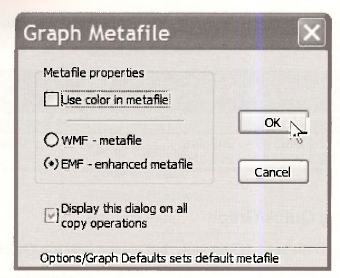
Click OK. The resulting graph shows the two series plots in a single window. In EViews the curves are in two different colors, but this will not show in a black and white document. The programmers at EViews have thought of this problem. Click inside the graph and enter Ctrl+C to copy. In the Graph Metafile box that opens uncheck the box “Use color in metafile.” Click OK.
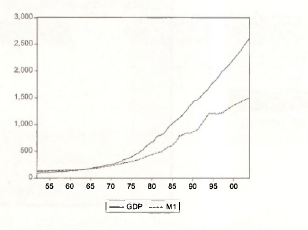
In your document enter Ctrl+V to paste the black and white graph. Now the graph lines show up as solid for GDP and broken for Ml so that the difference can be viewed.
To save the graph, click Name and enter the name GDP_Ml_PLOT. Click OK. Close the graph by clicking “X”. You will find an icon in the workfile window.
If you double click this icon up will pop the graph you have created.
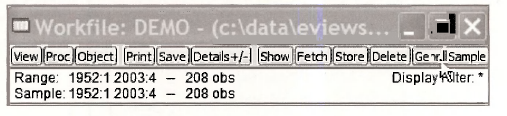
4. Saving your workfile
Now that you have put lots of work into creating new variables, plots, and so on, you can Save what you have done. On the workfile menu select the Save button
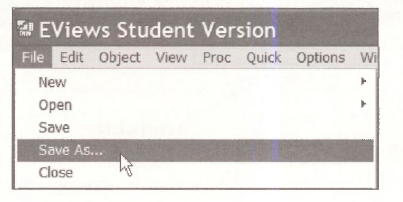
In the following window, IF you click OK then all the objects you have created will be saved into the workfile demo.wfl. You may wish to save these results using a different name, so that the original data workfile is not changed. To save the workfile, select File/Save As on the main EViews menu
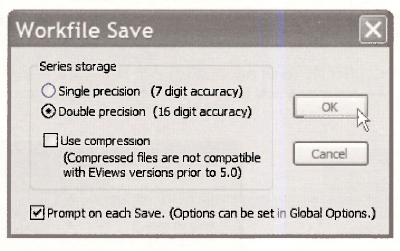
We will use the name demo chl.wfl for this workfile. Enter this and click OK. You will presented with some options. Use the default of Double precision and click OK.
You will note that the workfile name has changed.
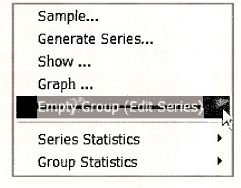
5. Opening an empty group
The ability to enter data manually is an important one. In Chapter 17 we show all the ways you might enter data into EViews. Select Quick/Empty Group (Edit Series) from the EViews menu.
A spreadsheet opens into which you can enter new data. The default name for a new series is SER01 that we will change. As you enter a number press Enter to move to the next cell. You can add new data in as many columns as you like.
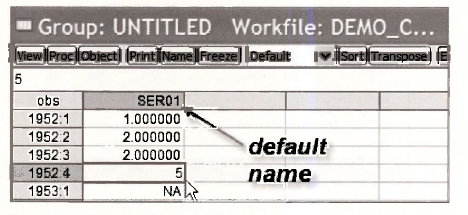
When you have finished entering the data you wish, click the red X in the upper right corner of the active window. You will be asked if you want to “Delete Untitled GROUP?” Select Yes. In the workfile demo chl.wfl you will now find the new series labeled
![]()
To change this name, select the series (by clicking) then right-click in the shaded area. A box will open in which you can enter a new name for the “object” which in this case is a data series. Press OK
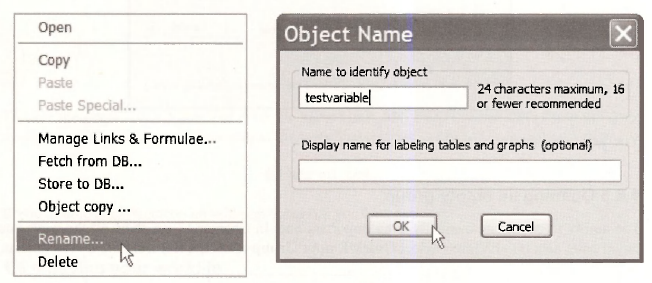
You can go through these same steps to delete an unwanted variable, such as the one we have just created. Select the series “TESTVARIABLE” in the workfile, and right click. Select Delete. In the resulting window you will be asked to confirm the deletion. Select Yes.

More than one series or objects can be selected for deletion by selecting one, then hold down the Ctrl-key while selecting others. To delete all these selected objects right-click in the blue area, and repeat the steps above.
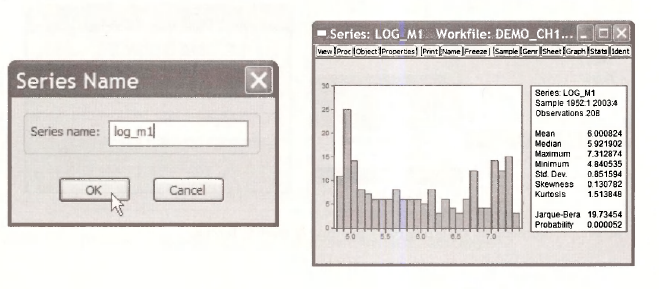
6. Quick/Series statistics
The next item on the EViews Quick menu is Series Statistics. Select Quick/Series Statistics/Histogram and Stats

In the resulting window you can enter the name of the series (one) for a which you desire the summary statistics. Then select OK.
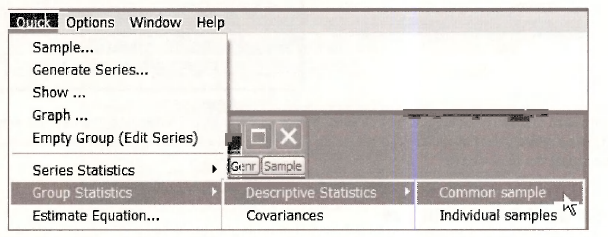
7. Quick/Group statistics
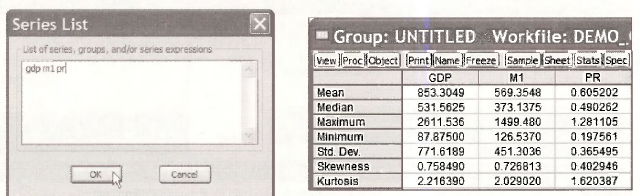
We can obtain summary statistics for a Group of series by choosing Quick/Group Statisitcs.
Enter the series names into the box and press OK. This will create the summary statistics table we have seen before. You can Name this group, or Freeze the table, or copy and paste using Ctrl+C and Ctrl+V.
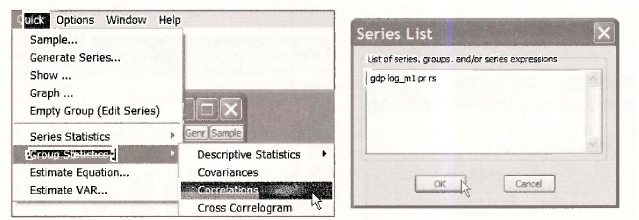
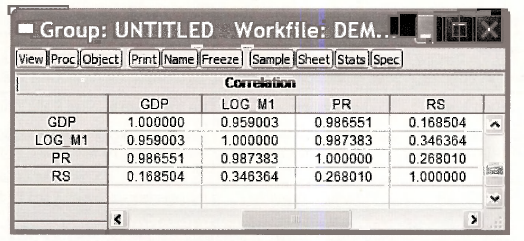
Another option under Quick/Group Statistics is Correlations. Enter the names of series for which the sample correlations are desired and click OK.
The sample correlations are arranged in an array, or matrix, format.
Source: Griffiths William E., Hill R. Carter, Lim Mark Andrew (2008), Using EViews for Principles of Econometrics, John Wiley & Sons; 3rd Edition.
20 Sep 2021
20 Sep 2021
20 Sep 2021
20 Sep 2021
20 Sep 2021
20 Sep 2021