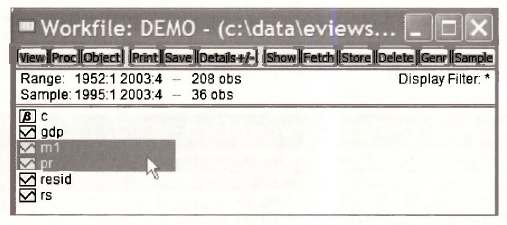
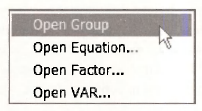
Rather than examining one series at a time we can view several. In the workfile window select the series Ml and then while holding down the Ctrl-key select the PR series. Double click inside the blue area to open what is called a Group of variables.
Click on Open Group.
A spreadsheet view of the data will open.
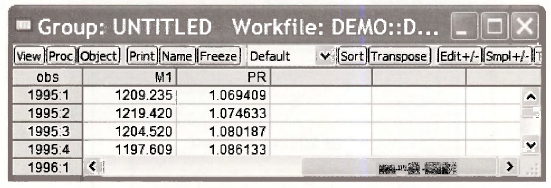
Note that the series begins in 1995:1 because we changed the Sample range in Section 1.4.4.
1. Summary statistics for several series
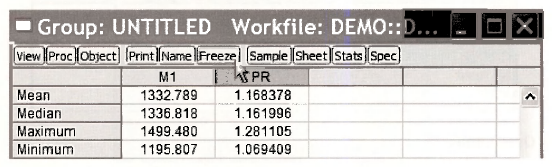
From the spreadsheet we can again examine the data by selecting the View button. Select Descriptive Stats/Common Sample.
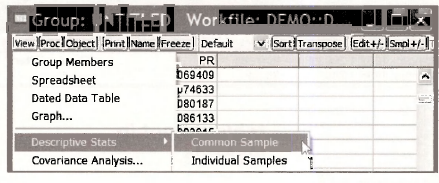
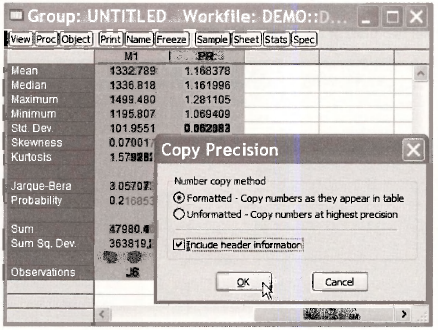
The result is a table of summary statistics is created for the two series (variables) in the group.
2. Freezing a result
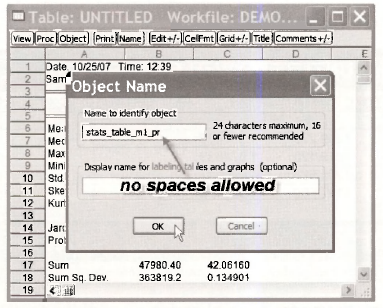
These results can be “saved” several ways. Select the Freeze button. This actually saves an image of the table. In the new image window, select the Name button. Enter a name for this image, which EViews calls an Object. The name should be relatively short and cannot contain any spaces. Often underscores can be used to separate words to make recognition easier.
Click OK, then close the Object by clicking on the red X. Check back in the workfde and you will now see a new entry, which is the table you have created.
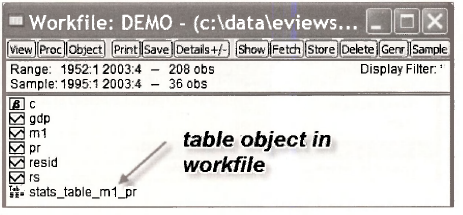
The table can be recalled at any time by double clicking the Table icon
3. Copying and pasting a table
To copy these into a document directly, highlight the table of results (drag the mouse while holding down its left button), enter Ctrl+C. In the resulting box click the Formatted radio button, check the box to Include header information, and click OK. This copies the table to the Windows clipboard, which then can be pasted (Ctrl+V) into an open document.
This same method can be used for basically any table in EViews. For example, if you open the saved table “STATS TABLE Ml PR” you can highlight the results, then copy and paste as we have done here.
4. Plotting two series
Return to the spreadsheet view of the two series Ml and PR. Select View/Graph. In the resulting dialog box, select Multiple graphs in the Multiple series menu.
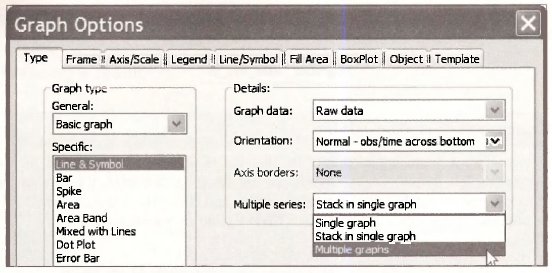
Click OK to obtain two plots of the series
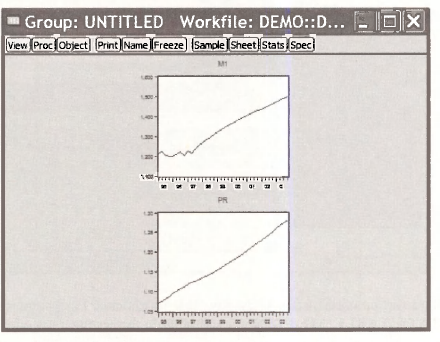
We can Freeze this picture, then assign it a Name for future reference.
5. A scatter diagram
A scatter diagram is a plot of the data points with one variable on one axis and the other variable on the other axis. In the Group screen click View/Graph. Select Scatter as the specific type of graph.
Click OK. Copy the graph by clicking inside the graph area, entering Ctrl+C to copy, then paste into a document using Ctrl+V. The resulting graph is on the next page. Recall that we are still operating with the sample from 1995:1 to 2003:4, which is only 36 data points.
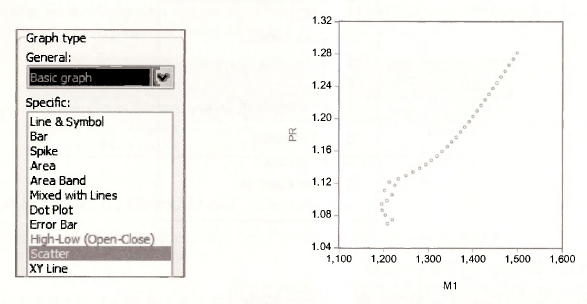
The variable Ml is on the horizontal axis because it is the first series in the spreadsheet view.
Click the red X in the Group window. When you do this you will be faced with some choices.
The Group consists of the two series Ml and PR. This Group can be saved by selecting Name and assigning a name.

In the workfile window you will find a new object for this group.
![]()
Source: Griffiths William E., Hill R. Carter, Lim Mark Andrew (2008), Using EViews for Principles of Econometrics, John Wiley & Sons; 3rd Edition.
27 Oct 2020
20 Sep 2021
20 Sep 2021
20 Sep 2021
20 Sep 2021
20 Sep 2021