The indication of a trending stock usually is gauged by whether the stock price is above or below a moving average. The longer the moving average, the longer the trend the relationship represents. Looking at how many stocks are trending gives us a measure of market strength.
1. Coppock Curve
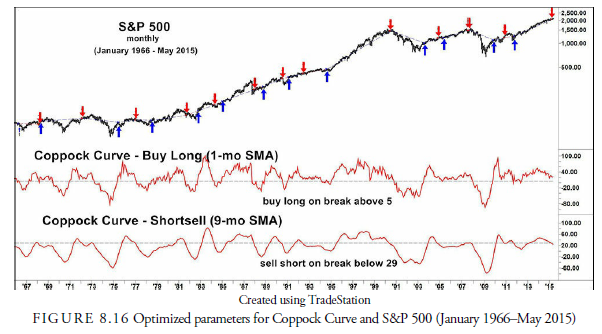
In October 1965, a quasi-economist named Edwin “Sedge” Coppock wrote an article in Barron’s Magazine describing a long-term momentum oscillator he had discovered. It was based on a study he had performed for his church that had asked him to invest their funds. His premise was that the period of a moving average or rate of change should be related to human psychology, and the closest analogy he could come up with after talking with the local bishop was the time it took a person to get over bereavement of a lost friend or relative. The bishop reportedly mentioned 11 to 14 months, and these became the basis of Coppock’s Index or Curve. It is calculated as the 10-month, weighted-moving average of the sum of an 11- month rate of change and a 14-month rate of change in a market index such as the S&P 500. Using the original parameters between June 1963 and April 2015, we found its performance between a buy signal and subsequent market peak to average 64.2% for on average 35.2 months. When we included the times when the index crossed below zero for short sales, we found the performance about even with the buy-and-hold. In line with the thinking that market tops are long and often flat whereas bottoms are sharp and short, the sell-short criteria caused the Coppock Index to sell far too soon; thus, it lost the performance potentially gained if it had remained invested longer.
To optimize the parameters (see Figure 8.16), we decided to leave the 11- and 14-month rate of change as is (the reasoning is too good) and optimized the moving averages (one for buys and one for short-sales) and the breakpoint for each moving average. The parameters turned out to be 1 and 9 for the buy and short-sale moving averages respectively and 5 and 29 for the breakpoints respectively. The annual rate of return was 7.13%, and the total return was 3,707% versus 2,367% for the buy-and-hold.
2. Number of Stocks Above Their 30-Week Moving Average
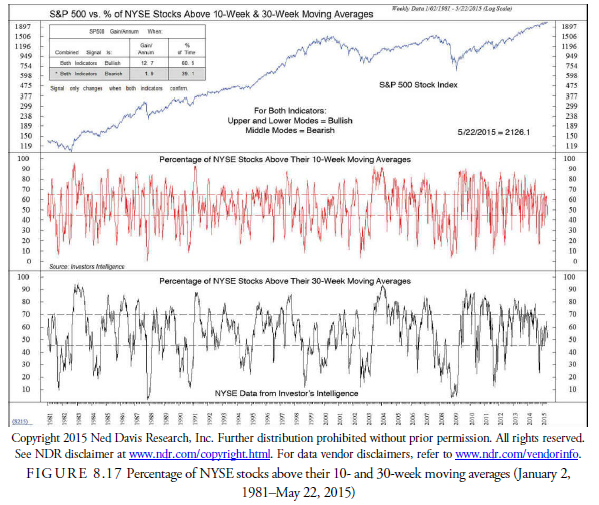
One indicator of overbought and oversold markets, as pictured in Figure 8.17, is the number of stocks above or below their 30-week moving averages. This indicator essentially measures the number of stocks in uptrends and downtrends. It is a contrary indicator, however, in that when the percentage of stocks above their 30-week moving averages reaches above 70%, the market is inevitably overbought and ready for a correction. Conversely, when the percentage of stocks below their 30-week moving average declines below 30%, the market is at or close to a bottom. Investors Intelligence, Inc. popularized this indicator. It has developed other rules for action between the 30% and 70% levels that follow intermediate-trend turns.
3. The 80/60 Rule
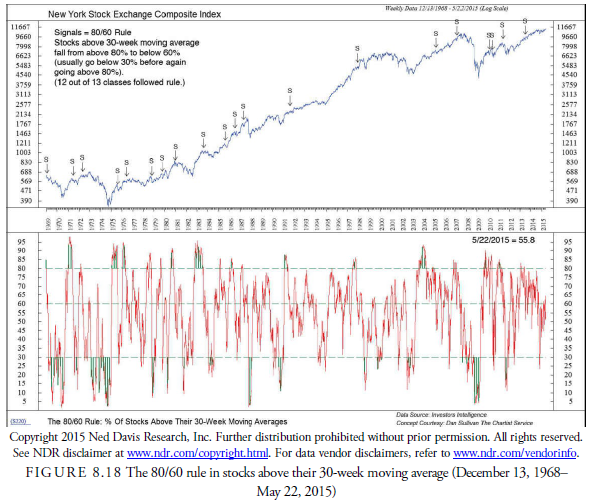
One interesting variation in the use of stocks above their 30-week moving average is the 80/60 rule. This rule states that when the percentage of stocks above their 30-week moving average has been greater than 80% and then declines below 60%, the percentage will decline to or close to 30%. In other words, a serious decline will likely follow such a signal. Figure 8.18 by Ned Davis Research, Inc. suggests that of the 20 instances of this occurring since 1968, 17 resulted in a general market decline.
Source: Kirkpatrick II Charles D., Dahlquist Julie R. (2015), Technical Analysis: The Complete Resource for Financial Market Technicians, FT Press; 3rd edition.
I will right away take hold of your rss feed as I can not find your email subscription hyperlink or e-newsletter service. Do you’ve any? Kindly allow me understand so that I may just subscribe. Thanks.