Although market sentiment indicators generally focus on spotting long-term trend reversals, the concept of sentiment can be used as a short-term contrarian indicator. Let’s look at a few ways in which following these indicators might provide clues to short-term trading opportunities.
1. Breadth and New Highs to New Lows
Although breadth and new high-low data tend to be indicators of trend, and divergence analysis is useful in determining when a known trend may be reversing, short-term readings of breadth and new high-low data are often contrary indicators. For example, when the daily breadth ratio of advances to declines rises to 2/1 or 3/1, the subsequent market direction is more often down than up. The opposite is also true for days in which the advance-decline ratio is 2/1 or 3/1 on the downside. It often provides excellent buying opportunities for the short term (that is, the next week).
New highs and new lows show the same results. Trading with the longer-term trend is the best method of maximizing profits. Entering the trend right after it has been recognized, however, is often not profitable, at least until prices have retraced from their initial reaction. Thus, for example, if the market is above its 200-day moving average and is presumably in a longer-term uptrend, whenever the averages break to new 10-day lows is an excellent time to go long. Oppositely, when the market is below its 200-day moving average (and thus in a longer-term downtrend) and rallies take prices above their 10-day highs, you have the best opportunity to sell short. In this manner, the use of new highs and new lows can be used as a contrary signal within the major trend and a way of profiting from price dispersions from the mean trend.
2. Net Ticks
Ticks represent actual trades. When a stock changes price, even by the smallest amount, either an uptick or a downtick is produced. If the stock trades at its previous price, a zero-tick is produced. By summing at any one instant the number of upticks versus downticks, the day trader has an indicator of market action across the board. It is similar to an advance-decline ratio or difference except that it is based on much more sensitive intraday data.
Generally, tick data is used as a contrary indicator because it measures short-term bursts of enthusiasm or fear. Extreme readings may indicate a longer-term change in trend, but usually the tick ratio oscillates within bounds throughout the day. When it is oversold, traders will buy into the short-term fear, and when it is overbought, they will sell into the temporary enthusiasm. Ratios and moving averages are used with this data in a similar manner to breadth statistics. Ticks can also be calculated for averages and indices such as the Dow Jones Industrial, where only the stocks included in the average are measured.
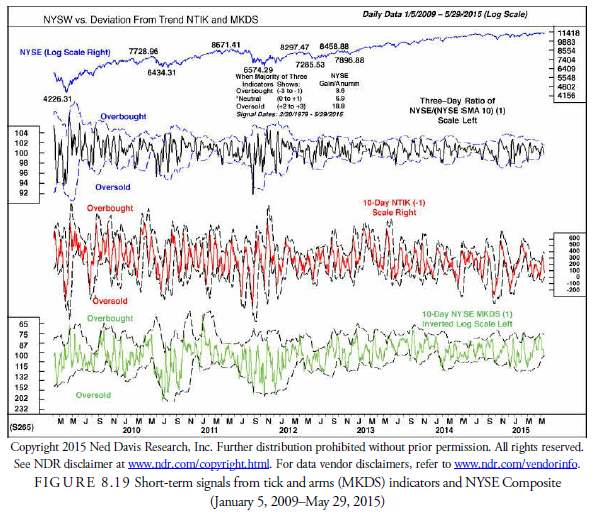
Closing ticks can also be used similar to daily breadth statistics. Closing ticks represent the trading action just at the close of trading and show whether traders are anxious or ambivalent. In Figure 8.19, a ten-day moving average of net ticks shows oscillations in line with the averages. Combining this indicator with one of the Arms Index (MKDS) and the NYSE Composite, Ned Davis Research, Inc. found specific levels at which significant market moves could develop.
Source: Kirkpatrick II Charles D., Dahlquist Julie R. (2015), Technical Analysis: The Complete Resource for Financial Market Technicians, FT Press; 3rd edition.
very nice post, i certainly love this web site, carry on it