Using a Computer to Code in Content Analysis

This section assumes that the documents to be coded are available in a word processing format such as WordPerfect and that coding proceeds with the computer program called Textbase Alpha. Textbase Alpha was designed for the analysis of qualitative data, but it was not specifically oriented toward traditional content analysis. However, it is simple to use, and it performs the basic content analysis tasks. (The distinction between qualitative analysis programs and content analysis programs is described in appendix I.) There are seven steps to coding such documents.

  1. Edit the documents with the word processor. While content analysis programs ordinarily have a text editor function, these are usually primitive; some analysis programs require that margins have particular settings and other special formats. With Textbase Alpha, a feature called “prestructured coding” can be used to some advantage. Suppose a document contains a series of paragraphs, each a response to an opemended question on a mail-out interview. Pressing a Textbase Alpha function key automatically codes the paragraphs with appropriate labels such as Question 1, Question 2, and so on, so that they can be retrieved or counted by their labels. For prestructured coding to work, the first word of each paragraph must be the label and the paragraph must have a hanging indent.
  2. Create an ASCII file with the word processor. It is usually necessary to strip away the word processor’s formatting codes by saving the file as an ASCII file. Content analysis programs can import ASCII files. In the Textbase Alpha example, WordPerfect must be used to create the ASCII file.
  3. Start the content analysis program and import the ASCII data files. Content analysis programs follow more-or-less standard procedures for starting and importing files. Some programs require that text lines be numbered; some do this automatically and other require a separate step. In the Textbase Alpha program, the coder imports the ASCII files. Lines are numbered by clicking on a Textbase Alpha menu choice.
  1. Attach codes to text segments. This involves marking the boundaries of each segment and inserting a code. With most programs, a segment starts at the beginning of a line and ends at the fine’s end. If a sentence starts or ends in the middle of a fine, the whole line is marked. With some programs, codes are first inserted manually and then keyed into the computer. With all programs, this two-stage process is an option. Textbase Alpha is unusual in that a segment can begin or end in the middle of a fine. Boundaries are marked according to cursor position, and codes are entered in a data entry box at the bottom of the screen. The coder simply moves the cursor through the text, stopping where necessary to attach codes to segments.
  2. Analyze the data. Coding in effect creates a database of categorical variables. All content analysis programs have some ability to manipulate and display them. Usually the database can also be exported for further analysis with a statistical program. Textbase Alpha can calculate code frequencies for all documents or for selected documents. Individual documents can be labeled with up to 15 variables like socioeconomic factors, coder name, date, and so on.

It can also count words without coding them. (We discuss data analysis at some length in chapter 5.)

  1. Print the results. The printouts for most programs have limited flexibility. However, the results can usually be exported to a word processor for editing. In our Textbase Alpha example, the results of analysis can be either printed or written to a WordPerfect file that can be opened later.
  2. Export the results. Most content analysis programs can create ASCII files so that the results can be exported either to a word processing program for editing and subsequent incorporation into a report or to a statistical program for further analysis. Some programs can export files specifically for standard statistical packages such as SPSS. Textbase Alpha can construct files for display and for statistical analysis in programs such as SPSS.

Source: GAO (2013), Content Analysis: A Methodology for Structuring and Analyzing Written Material: PEMD-10.3.1, BiblioGov.

Preparing for Data Analysis in Content Analysis

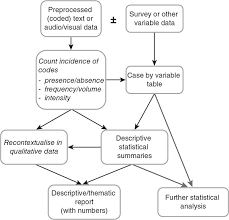
The basic analytic task in content analysis is to count the occurrence of codes, whether all occurrences of a given category (for example, all occurrences of Stars and Stripes articles that portray a negative image of the military) or only certain subcategories of occurrences (for example, Separate counts of such articles in the Pacific and European editions). Planning the counting task in advance avoids duplicative and unnecessary effort. However, using computer programs to do the counting lessens the burden and helps the analysis evolve (assuming, of course, that the appropriate variables have been coded).

The choice of software is important because programs differ substantially. A form of analysis that might be easy to implement with one program can be awkward or even impossible with another. (Appendix II gives a brief summary of this variation.) Evaluators should consult with someone who is familiar with several types of software before choosing one and may find it advisable to use more than one computer package.

Source: GAO (2013), Content Analysis: A Methodology for Structuring and Analyzing Written Material: PEMD-10.3.1, BiblioGov.

Estimating Reliability of Content Analysis

When several coders code the documents, then- consistency is important. If the coders differ substantially, then the results of the content analysis become questionable. Chapter 4 outlined steps for minimizing unreliability. Another important step is to assign selected documents to several coders at once so that estimates of reliability can be made (see appendix M).

Source: GAO (2013), Content Analysis: A Methodology for Structuring and Analyzing Written Material: PEMD-10.3.1, BiblioGov.

Counting a Code’s Frequency in Content Analysis

Drawing inferences from the frequency of codes is the simplest and often the most useful form of data analysis. Drawing conclusions in the Stars and Stripes assignment, evaluators counted the number of articles that presented a negative image of the military and compared the number to the number of wire service articles with negative images. Because the numbers were sufficiently large, the evaluators used percentages. The analysis showed that 47 percent of the wire service stories portrayed a negative image but that the European edition had only 35 percent and the Pacific edition 27.

Source: GAO (2013), Content Analysis: A Methodology for Structuring and Analyzing Written Material: PEMD-10.3.1, BiblioGov.

Finding Associations in Content Analysis

Beyond simply counting, evaluators might look for an association between two or more variables. In the Stars and Stripes assignment, the frequency of news articles on various topics was compared between the Pacific and European editions. In the language of content analysis, the variable “topic” was compared to the variable “edition.” Topic had the subcategories military, Iran-contra, AIDs, strategic treaty, and presidential campaign.

The final Stars and Stripes report contained a table similar to table 5.1, with which we can examine the association between topic and edition. If the data were to show that knowledge of one variable provides us with knowledge about the other, we would then say that the variables were associated. For example, suppose we have a bin containing 100 randomly chosen articles from the Pacific edition and 100 from the European edition. If we randomly select one article from the bin, and if it is about Iran-contra, does knowledge about that topic tell us which edition the article appeared in? If the answer is yes, the two variables are associated.

Table 5.1 shows that the percentage of articles on Iran-contra was somewhat greater in the Pacific edition; the percentage of articles on the presidential campaign was somewhat greater in the European edition. The remaining categories do not show much difference. Thus, there may be a weak association between topic and edition. That is, topic only is somewhat predictable from edition, or edition only is somewhat predictable from topic.

A table like this may disclose a relatively strong relationship between variables, but often the relationship is ambiguous. By subjecting the data to a statistical analysis, moderate or weak associations can readily be established. Because both variables are unordered—that is, they are nominal variables—we could compute a statistic like Cramer’s V with statistical software.1 Cramer’s V ranges from 0, indicating no association, to 1, indicating perfect association. The data in table 5.1 yield a value for V turns of 0.09, a very modest degree of association.

Source: GAO (2013), Content Analysis: A Methodology for Structuring and Analyzing Written Material: PEMD-10.3.1, BiblioGov.

Reporting the Methodology and Results of Content Analysis

The methodology and results of a content analysis should be reported the way they are for other evaluations. The methodology should be described in sufficient detail that readers will have a clear understanding of how the work was carried out and its strengths and limitations. For example, the report should reveal

  • the evaluation question addressed;
  • the nature of the material analyzed;
  • the variables coded and the coding categories;
  • whether documents were sampled and, if so, how;
  • the recording units;
  • the coding procedures and copies of coding instruments;
  • the statistical analysis techniques; and
  • limitations that would prevent another from using the information correctly.

The verbal conclusions from the content analysis should be backed up by tables and statistical summaries. Where it is applicable, evaluators should include statements about the statistical precision of the findings.

Source: GAO (2013), Content Analysis: A Methodology for Structuring and Analyzing Written Material: PEMD-10.3.1, BiblioGov.

Planning the Content Analysis

1. Be Clear About the Questions

The evaluation questions drive the study. If they are Questions ambiguous or not suited to the users’ needs, even a well-implemented method will produce findings of doubtful value. To be clear about the questions means to state them as specifically as possible so that the answers will be useful to decisionmakers. One exception to this rule—probably the only exception—is when the main purpose of the study is for evaluators to learn systematically about a substantive area in preparation for doing a main study. When this is the goal, the findings may not be directly useful to decisionmakers, but they should be a stepping stone to subsequent studies designed to serve policy needs.

2. Consider the Broad Options

Content analysis is only one approach to drawing conclusions from textual data. Other options that allow for the retrieval and manipulation of actual segments of text are briefly discussed in appendix I. The textual methods referred to there may be better suited to answering some evaluation questions than content analysis.

3. Define the Variables Carefully

The need for careful definitions of the variables, including the specification of their categories, cannot be overstated. Pitfalls abound: defining variables that cannot be used to answer the evaluation questions, defining variables that are so ambiguous as to defy reasonable categorization and interpretation, specifying categories that are not mutually exclusive and exhaustive, and specifying categories ambiguously so that coders can work only capriciously. Faulty definition is one of the main contributors to unreliability in the coding process.

Defining the variables should begin early because the definition may require a restatement of the evaluation questions. The possibility of redefinition should extend into the implementation phase, because training coders constitutes a test of the categories and may reveal problems in making the connection between the variables’ definitions and the assignment of codes.

4. Define Recording Units Carefully

The selection of recording units is based upon the nature of the variables and the textual material to be coded. For a given variable, different recording units can produce different findings. Therefore, considerable thought must go into the decision on recording units. Later, the coders must understand the recording units and apply them in a way such that the reliability of the coding process is maintained. When the recording units have obvious physical boundaries, as whole text, paragraphs, and words do, the coder’s task is relatively easy. When the theme is a recording unit, as it often is in an evaluation, extra precautions must be taken to avoid unreliability.

5. Develop an Analysis Plan

The steps in content analysis are deceptively simple and may therefore tempt the evaluator to postpone serious thought about data analysis until coding has been completed. This would be a mistake. In designing and implementing a content analysis, evaluators will come to several decisions that bear on whether the analysis will be possible. These decisions most notably, defining the variables, defining the recording units, and choosing the software—should not be made until after a preliminary data analysis plan has been developed. Otherwise, the evaluator may arrive at the time for data analysis and find some important options foreclosed.

6. Plan for Sufficient Staff and Time

Content analysis can be time-consuming. A coding manual must be prepared and, probably, revised several times. Coders must be trained and given time to practice coding until their reliability is satisfactory. These two steps alone can easily take a couple of months. The time required for the final coding process depends upon the amount of material to be coded, the number of variables, the number of coders, and the judgment required for coding decisions. Careful definition of variables will help keep the need for judgment to a minimum but, in most analyses, some variables will be complex and subtle and coding decisions will take time.

Source: GAO (2013), Content Analysis: A Methodology for Structuring and Analyzing Written Material: PEMD-10.3.1, BiblioGov.

Coding in Content Analysis

1. Produce a Coding Manual

A good coding manual is indispensable. AvoSrf the temptation to save time by not producing one or by producing only the skeleton of one. The time spent in being complete will be more than repaid by making the coders’ task easier and faster and, especially, by ensuring coding of the highest quality.

2. Train the Coders Thoroughly

Good training is essential. Even experienced coders need to learn about the aims of the evaluation, the material to be coded, and the coding system. They may also need training in the software. Inexperiencedcoders will additionally need guidance in good coding practice-keeping proper records, adopting tactics for avoiding errors, knowing when to seek advice, and so on. All coders need practice in applying the coding system to examples of the material to be coded.

3. Pretest the Coding System

Pretests can be carried out in conjunction with training. Pretests with the persons who will do the final coding affords the opportunity to fix problems by redefining variables, especially the categories. Coders-in-training can give direct feedback on the difficulties they have with the coding system. There is no substitute. Pretests also provide a means for making preliminary estimates of reliability. Indeed, actual coding should not begin until reliability is satisfactory.

4. Develop Management Procedures

A single person should be given overall responsibility for the document coding. The best choice is usually someone who has coding experience and who will also perform some of the coding as a head coder. This person should develop detailed procedures for keeping track of documents, assigning them to coders, and maintaining a log of the process. Usually the head coder also provides the first level of troubleshooting: responding to queries from coders, resolving ambiguities about categories, and making at least preliminary decisions to remove problematic documents from the database.

Source: GAO (2013), Content Analysis: A Methodology for Structuring and Analyzing Written Material: PEMD-10.3.1, BiblioGov.

Analyzing and Reporting the Data in Content Analysis

1. Cross-Check Preliminary Results

Things are not always what they seem. Try to verify findings by using related variables or slightly different analysis methods. This is also a time to check on the reliability of the coding process.

2. Apply Statistical Tests

In some circumstances, statistical tests of significance may be appropriate. Use them to rule out chance as an explanation for the results.

3. Make External Comparisons

Compare the content analysis results to other forms of evidence, either in the same evaluation or from the literature on the topic.

4. Do Not Overstate the Conclusions

Remember the origins of the data and the assumptions they are based on. Confidence in the answers to evaluation questions and the forcefulness of the implications derived from them must fit the data and the methodology. Sometimes confidence is high but, at other times, the conclusions must be carefully qualified.

Source: GAO (2013), Content Analysis: A Methodology for Structuring and Analyzing Written Material: PEMD-10.3.1, BiblioGov.

Analysis of Qualitative Data in Content Analysis

Content analysis applies to textual information in the form of words. An analyst can classify text into categories as described in chapter 1. The categories are treated like numerical data in subsequent statistical manipulations. The statistical analysis permits the analyst to draw conclusions about the information in the text. This is the traditional form of content analysis.

Content analysis, as defined in this paper, can be viewed as being one among a number of methods for analyzing textual data. Under the title of qualitative data analysis, Tesch (1990), describes many possibilities for analyzing textual data. A number of those alternatives classify text into categories but do not give numerical labels to the categories in preparation for statistical manipulation. (See for example, Mies and Huberman (1994) and Strauss and Corbin (1990).) Analysis in these other qualitative approaches typically involves graphic manipulation and display of text segments in the form of either codes or actual words rather than statistical manipulation. Content analysis is usually confined to statistical analysis.

We might want to address some of the evaluation questions with textual data. These questions are best answered with content analysis and other forms of qualitative analysis. To a degree, software programs such as AQUAD can be used in either situation (Tesch, 1992). AQUAD was designed for the style of qualitative analysis that retains the text segments intact. It basically offers the ability to cut and paste coded segments of computerized documents. Its ability to count codes also gives it some content analysis capability.

In designing an evaluation that will use qualitative data, consideration should be given to a variety of approaches, including but not limited to content analysis. As always, the methods the analyst chooses should be matched to the evaluation questions.

Source: GAO (2013), Content Analysis: A Methodology for Structuring and Analyzing Written Material: PEMD-10.3.1, BiblioGov.

Software for Content Analysis

This appendix describes computer software that may be useful to content analysis. The list of programs here is by no means complete, and it is purely descriptive, not a GAO endorsement of any program. The descriptions focus on features of the software
that are necessary or optional for use in content analysis; they do not refer to other features that are not relevant to content analysis.

The content analyst must carry out several of these six functions:

Edit: generate and edit recorded information, including the creation of ASCII files.

Code: mark recording units and attach category codes.

Search: identify specific words, phrases, and categories.

Count: count the number of specific words, phrases, or categories in each recording unit.

Retrieve: retrieve specific words, phrases, or categories.

Export: create a computer file for analysis by statistical packages.

Therefore, the software in table II.I is described in this appendix primarily in regard to these functions. The table is organized so that the software with the greatest number of features is at the top, the least at the bottom.

1. askSam

askSam was designed not for content analysis but as a general purpose database manager that can handle structured and unstructured qualitative and quantitative data. 1 This description of its features is based on askSam version 2.0a for Windows. askSam has been used in several GAO projects that involved the analysis of large amounts of textual information, including (1) transcripts of focus group discussions; (2) structured interviews consisting of 100 questions asked of 200 persons, several of the
questions being open-ended; (3) a COBOL database transformed into_ an askSam database consisting of thousands of records, each including one open-ended free text field; and ( 4) an automated version of the GAO open recommendations report.2

Text to be coded could be prepared on a word processor and converted to an ASCII file and then imported to askSam. However, askSam can import information directly in a variety of formats such as dBase and WordPerfect (5.x and 6.0). The program’s built-in word processor is relatively flexible and can be used to enter data.

Text passages can be coded from within askSam’s word processor by text-editing. That is, while the text is displayed on the screen, a code is typed in at the beginning of the passage and a single character is placed at the end of the passage. A form of automatic coding is also available; a selected character that appears in the raw text, a colon for example, can serve as a code, or field character. The text that follows that code, on the same line, can be analyzed as a coded passage.

The program has strong search capabilities for words (including codes) and phrases. Words and phrases can be counted, thus providing the basis for content analysis. The full texts for all instances of a code can also be retrieved and displayed on the screen or printed. There is no simple way to export the results of code counts to statistical programs for further analysis.

askSam’s great versatility makes it harder to learn and somewhat more awkward to use than some of the more specialized programs such as AQUAD and Textbase Alpha

2. Textbase Alpha

Textbase Alpha was developed for the qualitative analysis of data from interviews. Although not designed for content analysis, it has some numeric analysis features, and it can produce an output file that SPSS can use directly for categorical data analysis.

Text to be coded is prepared on a word processor and converted to an ASCII file. A separate data file is created for each document. Supplementary data, such as identifiers and demographic variables may be added at this time.

In coding, the analyst moves the cursor to mark the beginning and end of a recording unit and then keys the code so that it appears in a special data entry box at the bottom of the screen. The program also includes a prestructured coding feature in which the paragraph format of the text (prepared in the word processor) leads to a form of automatic coding. This may be especially useful for handling the responses to interviews whose paragraph-like structure corresponds to a series of questions.

Textbase Alpha has flexible procedures for text retrieval by code. A search may be made across all documents or only selected ones (for example, only Hispanic respondents if ethnicity has been added as a demographic variable). The results of searching text passages are saved in an ASCII file, which can be viewed on screen or imported into a word processor for editing.

The frequency of some or all codes can be counted, with the results also stored in an ASCII file. The program will also count all or selected words in the textual material, and the count can be made for all or selected documents.

The program can construct an SPSS file in which each document corresponds to an SPSS case. Demographic variables and codes become SPSS variables.

3. AQUAD

Like Textbase Alpha, AQUAD was developed primarily for the analysis of qualitative data in circumstances in which there is no intent to transform the results to numbers. However, AQUAD has several features that make it useful for content analysis.

Textual material is prepared on a word processor and converted to ASCII files for processing by AQUAD. Each document constitutes one file. For example, if 10 interviews were conducted, 10 ASCII files would be prepared.

Coding in AQUAD can be performed with the textual material displayed on the screen as on a word processor. The cursor is moved to the line where the passage to be coded begins, and the code is entered. The code carries three kinds of information: the line where the segment begins, the line where it ends, and the category label. If the analyst prefers to mark the codes on hard copy first, AQUAD provides a shortcut by which they can be entered into the database.

Even though it was not designed as a content analysis program, AQUAD can be used to count code frequencies and to retrieve the coded passages in their entirety.

4. TEXTPACKPC

TEXTPACK PC was designed for analyzing open-ended survey questions but over the years it has been extended to a variety of applications such as content analysis and literary and linguistic analysis.

In Version V, Release 4.0, for MS/DOS, the text to be coded is prepared on a word processor, which also produces an ASCII file that the program can read. All documents are included in a single file. TEXTPACK PC transforms that file to others in TEXTPACK format for use in the actual analysis. The program has minimal text-editing capability; editing is best done with a word processor.

In coding, the analyst specifies a code “dictionary” of words, sequences of words, and word roots (that is, the beginnings of words). The dictionary is created in the form of an input file for TEXTPACK PC, and the coding is automatic in that the computer looks for and counts the matches of “words” in dictionary and character sequences in the text file. Unlike Textbase Alpha and AQUAD, the recording units that are counted are limited to words, phrases, or word roots in the text. TEXTPACK PC also performs a simple word frequency count (that is, without counting sequences or word roots) without the necessity of creating a code dictionary.

The text retrieval feature identifies and displays words in context. A dictionary file is used to specify the “words” to be searched. Results are displayed in standard KWIC format with identifying information so that each occurrence can be traced back to its location in the text.

A frequency count of codes, produced as described above, can be saved to a file in a form that SPSS and SAS.

5. Micro-OCP

Micro-OCP is the microcomputer implementation of a mainframe concordance program known as OCP, or Oxford Concordance Program. A concordance is an alphabetical list of words showing the context of each occurrence of each word. It makes word lists with frequency counts, indexes, and concordances from texts in a variety of languages and alphabets.

Although designed especially for literary analysis in which individual words are the recording units, the program can be used to perform content analysis by using a somewhat limited form of coding.

As with most other programs, the textual material would ordinarily be generated by a word processing program and converted to ASCII format for importation to Micro-OCP. To perform a content analysis, the analyst also requires a “command” file, which can be developed with a word processor or Micro-OCP. The command file is, in effect, a set of instructions that tells Micro-OCP what it is to do with the textual material.

Text passages can be coded with a word processor by inserting code characters at the beginning of a passage, but there is no way to mark the end of a passage. It is therefore possible to count the occurrence of codes, but the ability to retrieve a coded passage is limited, except when words are the recording units.

Different kinds of text passages can be marked (Micro-OCP calls the markings “references”) for later use in the analysis. For example, when the textual material is composed of answers to a series of interview questions, all responses to question 1 could be marked “Ql,” those to question 2 “Q2,” and so on. By appropriate use of Micro-OCP commands, a given content analysis could then be limited to responses to question 1, for example.

Micro-OCP searches for words and brings back the results in one of three basic forms: a word list, an index, or a concordance. Typical content analysis applications are producing (1) a word list of codes, along with the frequencies of the codes, (2) a concordance of selected words as a preliminary to other forms of analysis, (3) a concordance of codes as a crude way to retrieve partial text passages, and (4) an index of selected words or codes to provide the basis for a second-stage “look-up” of words or codes in the text. Used in these ways, Micro-OCP can provide a rudimentary form of content analysis.

6. Word Cruncher

WordCruncher indexes text files and retrieves and manipulates data from them for viewing or analysis.3 WordCruncher is primarily designed to display the text associated with words or word combinations (that is, the context). It also provides a count of the number of instances of each word and a way of creating a free-standing thesaurus, facilitating the development of categories for a content analysis.

Before analysts use WordCruncher for content analysis, they generate the text material and code it in a word processor. (Under some circumstances, WordCruncher generates second- and third-level codes automatically.) The codes consist of two parts: a reference symbol and a reference label (such as “questionlO”), which identify the location of words in the text.

Once the text has been coded, WordCruncher is used to produce an index—a list of words along with their frequencies. Then, when the analyst highlights a word and presses the enter key, the program finds each instance of the word and displays its context.

7. WordPerfect

A word processing program, such as WordPerfect, is indispensable for carrying out a content analysis. It can be used to create a textual database for later use •with other programs, to edit an existing database, to attach codes necessary for content analysis, and to convert from a word processor format to ASCII format. Virtually all word processors can perform these tasks and their editing capabilities are usually much superior to the primitive editing features found in most specialized content analysis programs.

Some word processors have powerful search features that are useful during the early stages of content analysis. WordPerfect has QuickFinder, which searches for words and phrases within files and across files. The analyst can then scroll through the text to find the words and phrases that QuickFinder has highlighted. Used in this way, the program can be helpful in defining variables and categories and in deciding what material to code.[1]

QuickFinder File Indexer is an enhanced search utility included in WordPerfect 5.2 and later versions. An index of all words in a file or files is created and saved as a basis for all searches. Using the index greatly increases the speed of the search.

QuickFinder allows the analyst to specify quite complex word patterns through the use of search modifiers. Thus, the analyst can search for files containing

  • each one of a set of words (Boolean AND);
  • any one of a set of words (Boolean OR); .
  • one word but not another;
  • particular word forms (using “?” and as wild-card characters);
  • phrases (words next to each other);
  • two words within n number words of each other; and
  • two words in the same line, sentence, paragraph, page, or section (between two hard pages).

Source: GAO (2013), Content Analysis: A Methodology for Structuring and Analyzing Written Material: PEMD-10.3.1, BiblioGov.

Intercoder Reliability in Content Analysis

An important measure forjudging the quality of a content analysis is the extent to which the results can be reproduced. Known as intercoder reliability, this measure indicates how well two or more coders reached the same judgments in coding the data. Among the variety of methods that have been proposed for estimating intercoder reliability, we discuss three.

A simple and commonly used indicator of intercoder reliability is the observed agreement rate. The formula for this is

where

P0 = observed agreement rate,

na = number of agreements, and

n0 = number of observations.

Table III.l gives an example from Krippendorff (1980). Coders A and B have each assigned category labels 0 or 1 to a total of 10 recording units. They agree in 6 out of 10 cases, so

Although this indicator is simple, the observed agreement rate is not acceptable because it does not account for the possibility of chance agreement. This is important because even if two coders assign codes at random, they are likely to agree at least to some extent. The expected agreement rate arising from chance can be calculated and used to make a better estimate of intercoder agreement.

The chance agreement rate is fairly easy to compute when the data are redisplayed as in table III.2. Each pair of observations from coders A and B will fall into one of four cells: (1) A and B agree that the code is 0, (2) A codes 0 and B codes 1, (3) A codes 1 and B codes 0, and (4) A and B agree that the code is 1. If we count the number of instances of each pair, the results can be displayed as in table III.2.

The following formula gives the chance agreement rate:

where

Pc = chance agreement rate,

ni = observed row marginals (from table III.2),

n.i= observed column marginals (from table III.2), and

n= number of observations.

Using the numbers in table III.2, the chance agreement rate is

Now the observed agreement rate of 0.6 does not look so good because, by chance, we could have expected an agreement rate of 0.56.

The chance agreement rate is accounted for in a widely used estimate of intercoder reliability called Cohen’s kappa (Orwin, 1994). The formula is

where

K= kappa,

Po = observed agreement rate, and

Pc= chance agreement rate.

With the data in table III.2, kappa is

Kappa equals 1 when the coders are in perfect agreement and equals 0 when there is no agreement other than what would be expected by chance. In this example, kappa shows that the extent of agreement is not very large, only 9 percent above what would be expected by chance.

Kappa is a good measure for nominal-level variables, and it is computed by standard statistical packages such as SPSS. Seigel and Castellan (1988) discuss kappa, including a large-sample statistic for significance testing. Kappa can be improved upon Appendix III Intercoder Reliability

when the variables are ordinal, interval, or ratio. Krippendorff (1990) provides very general, but more complicated, measures. Software programs for computing such variables have been developed in some design and methodology groups within GAO.

Source: GAO (2013), Content Analysis: A Methodology for Structuring and Analyzing Written Material: PEMD-10.3.1, BiblioGov.