The Pearson product moment correlation is a bivariate parametric statistic used when both variables are approximately normally distributed (i.e., scale data). When you have ordinal data or when assumptions are markedly violated, one should use a nonparametric equivalent of the Pearson correlation coefficient. One such nonparametric, ordinal statistic is the Spearman rho (another is Kendall’s tau, which we computed in the last chapter). Here you will compute both parametric and nonparametric correlations and then compare them. The variables of interest for Problem 8.2 are mother’s education and math achievement. We found in Chapter 4 that mother’s education was somewhat skewed, but that math achievement was normally distributed.
- What is the association between mother’s education and math achievement?
To compute Pearson and Spearman correlations follow these commands:
- Analyze → Correlate → Bivariate…
- Move math achievement and mother’s education to the Variables
- Next, under Correlation Coefficients, ensure that the Spearman and Pearson boxes are checked.
- Make sure that the Two-tailed (under Test of Significance) and Flag significant correlations are checked (see Fig. 8.6). Unless one has a clear directional hypothesis, twotailed tests are used. Flagging the significant correlations (with an asterisk) is optional but helps you quickly identify the statistically significant correlations.
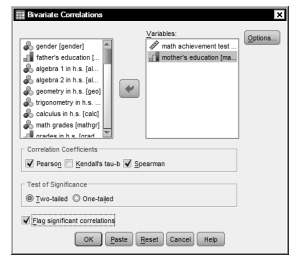
Fig.8.6. Bivariate correlations.
- Now click on Options to get Fig. 8.7.
- Click on Means and standard deviations and click on Exclude cases listwise. When requesting only one correlation, listwise and pairwise exclusion (of participants with missing data on one or both of these variables) are the same, but, as described later, which one you select may make a difference in a correlation matrix of more than one pair of variables.
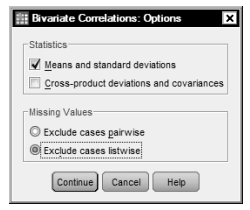
Fig.8.7. Bivariate correlations: Options.
-
- Click on Continue then on OK. Compare Output 8.2 to your output and syntax.
Output 8.2: Pearson and Spearman Correlations
CORRELATIONS
/VARIABLES=mathach maed
/PRINT=TWOTAIL NOSIG
/STATISTICS DESCRIPTIVES
/MISSING=LISTWISE.

Interpretation of Output 8.2
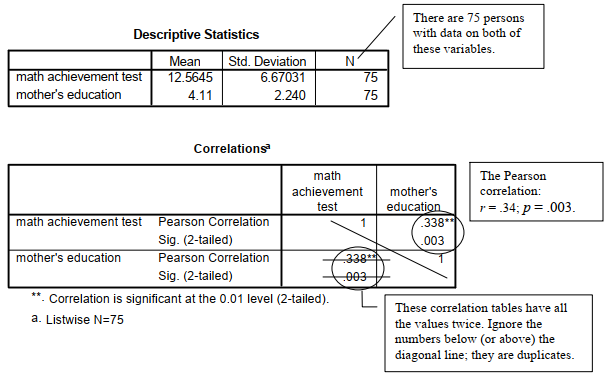
The first table provides descriptive statistics (mean, standard deviation, and N) for the variables to be correlated, in this case math achievement and mother’s education. The two tables labeled Correlations are our primary focus. The information is displayed in matrix form, which unfortunately means that every number is presented twice. We have provided a call out box to help you.
The Pearson Correlation coefficient is .34; the significance level (Sig.) or p is .003 and the number of participants with both variables (math achievement and mother’s education) is 75. In a report, this would usually be written as r (73) = .34, p = .003. Note that the degrees of freedom (N – 2 for correlations) is put in parentheses after the statistic (r for Pearson correlation), which is usually rounded to two decimal places and is italicized, as are all statistical symbols using English letters. The significance, or p value, follows and is stated as p = .003.
The correlation value for Spearman’s rho (.32) is slightly different from r, but usually, as in this case, it has a similar significance level (p = .006). The nonparametric Spearman correlation is based on ranking the scores (1st, 2nd, etc.) rather than using the actual raw scores. It should be used when the scores are ordinal data or when assumptions of the Pearson correlation (such as normality of the scores) are markedly violated. Note, you should not report both the Pearson and Spearman correlations; they provide similar information. Pick the one whose assumptions best fit the data. In this case, because mother’s education was markedly skewed, Spearman would be the more appropriate choice. Problem 8.1 showed you a way to check the Pearson assumption that there is a linear relationship between the variables (i.e., that it is reasonable to use a straight line to describe the relationship).
It is usually best to choose two-tailed tests, as we did in Fig. 8.6. We also chose to flag (put asterisks beside) the correlation coefficients that were statistically significant so that they could be identified quickly. The output also prints the exact significance level (p), which is more specific than just knowing it is significant by seeing the asterisk. It is best in a thesis or paper table to report the exact p, but if space is tight you can use asterisks with a footnote, as did Output 8.2.
Example of How to Write About Problem 8.2
Results
To investigate if there was a statistically significant association between mother’s education and math achievement, a correlation was computed. Mother’s education was skewed (skewness = 1.13), which violated the assumption of normality. Thus, the Spearman rho statistic was calculated, r(73) = .32, p = .006. The direction of the correlation was positive, which means that students who have highly educated mothers tend to have higher math achievement test scores and vice versa. Using Cohen’s (1988) guidelines, the effect size is medium for studies in this area. The r2 indicates that approximately 10% of the variance in math achievement test scores can be predicted from mother’s education.
Source: Morgan George A, Leech Nancy L., Gloeckner Gene W., Barrett Karen C.
(2012), IBM SPSS for Introductory Statistics: Use and Interpretation, Routledge; 5th edition; download Datasets and Materials.
19 Sep 2022
30 Mar 2023
31 Mar 2023
29 Mar 2023
28 Mar 2023
16 Sep 2022