A very common measure of reliability in the research literature is Cronbach’s alpha. It usually is used to assess the internal consistency reliability of several items or scores that the researcher wants to add together to get a summary or summated scale score. Alpha is based on a correlation matrix and is interpreted similarly to other measures of reliability; alpha should be positive and usually greater than .70 in order to provide good support for internal consistency reliability.
Remember that in Chapter 7 we computed Cohen’s kappa to assess interobserver reliability for nominal data. In Chapter 9, we compute test-retest or parallel forms reliability.
- What is the internal consistency reliability for the four items in the pleasure with math scale?
To compute Cronbach’s alpha:
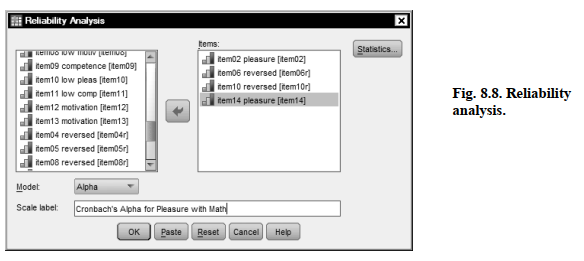
- Select Analyze → Scale → Reliability Analysis…
- Move item02 pleasure, item06 reversed, item10 reversed, and item14 pleasure to the right into the Items Be sure you use the reversed versions of items 6 and 10.
- Check to be sure that the Model is (See Fig. 8.8.)
- Type “Cronbach’s Alpha for Pleasure with Math” in the Scale label
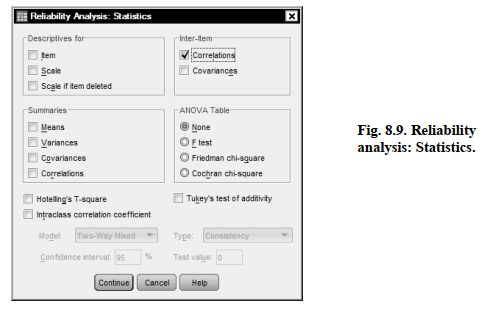
- Click on Statistics to get the Reliability Analysis: Statistics window (See Fig. 8.9).
- Under Inter Item check
- Click on Continue and
Compare your output to Output 8.4.
Output 8.4: Cronbach’s Alpha for the Pleasure Scale
RELIABILITY
/VARIABLES=item02 item06r item10r item14
/SCALE(“Cronbach’s Alpha for Pleasure with Math”) ALL
/MODEL=ALPHA /STATISTICS=CORR.
Reliability
Interpretation of Output 8.4
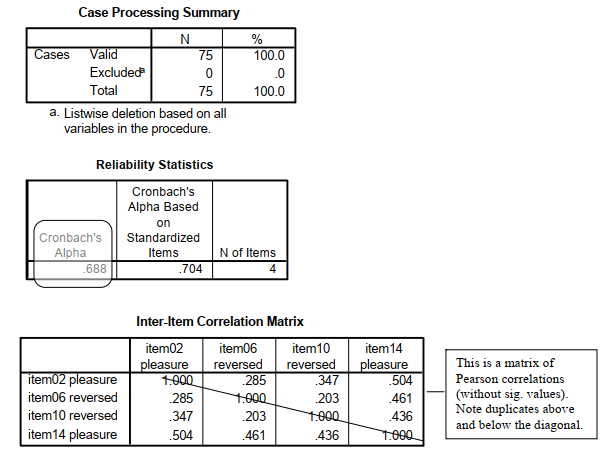
The Reliability Statistics table provides the Cronbach’s Alpha (.69) and an alpha based on standardizing the items (.70). Unless the items have very different means and SDs, you would use the unstandardized alpha (.69). This alpha is marginal in terms of acceptability as a measure of reliability because it is (slightly) less than .70. However, alpha is highly dependent on the number of items in the proposed summated scale so .69 is probably acceptable to most researchers for a four item scale.
The Inter-Item Correlation Matrix is read similarly to the correlation matrix in Output 8.3. Remember that each correlation (r) is given twice, both above and below the diagonal (1.000). Use only one. Note that the six correlations are all positive and range from .20 to .50.
Source: Morgan George A, Leech Nancy L., Gloeckner Gene W., Barrett Karen C.
(2012), IBM SPSS for Introductory Statistics: Use and Interpretation, Routledge; 5th edition; download Datasets and Materials.
28 Mar 2023
14 Sep 2022
27 Mar 2023
14 Sep 2022
28 Mar 2023
15 Sep 2022