As stated earlier, the Pearson correlation is the best choice for a statistic when you are interested in the association of two variables that have normal or scale level measurement for the two variables. Correlations do not indicate prediction of one variable from another; however, there are times when researchers wish to make such predictions. To do this, one needs to use bivariate regression (which is also called simple regression or simple linear regression). Assumptions and conditions for simple regression are similar to those for Pearson correlations; the variables should be approximately normally distributed and should have a linear relationship.
- Can we predict math achievement from grades in high school?
To answer this question, a bivariate regression is the best choice. Follow these commands:
- Analyze → Regression → Linear..
- Highlight math achievement. Click the arrow to move it into the Dependent
- Highlight grades in high school and click on the arrow to move it into the Independent(s) The window should look like Figure 8.10.
- Click on
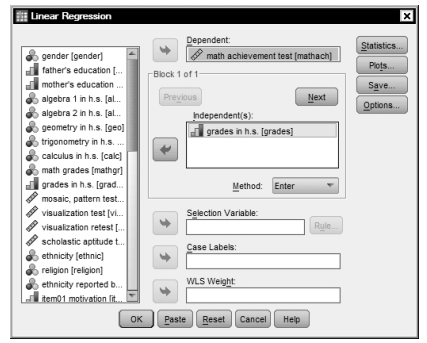
Fig. 8.10. Linear regression.
- Compare your output with Output 8.5
Output 8.5: Bivariate regression
REGRESSION
/MISSING LISTWISE
/STATISTICS COEFF OUTS R ANOVA
/CRITERIA=PIN(.05) POUT(.10)
/NOORIGIN
/DEPENDENT mathach
/METHOD=ENTER grades.
Regression

Interpretation of Output 8.5
In the fourth table, labeled Coefficients, the Unstandardized regression Coefficient in bivariate regression is simply the slope of the “best fit” regression line for the scatterplot showing the association between two variables. The Standardized regression Coefficient is equal to the correlation between those same two variables. (In Problem 8.6, multiple regression, we will see that when there is more than one predictor, the relation between correlation and regression becomes more complex, and there is more than one standardized regression coefficient.) The primary distinction between bivariate regression and bivariate correlation (e.g., Pearson) is that, in regression, one wants to predict one variable from another variable, whereas in correlation you simply want to know how those variables are related.
The Unstandardized Coefficients give you a formula that you can use to predict the y scores (dependent variable) from the x scores (independent variable). Thus, if one did not have access to the real y score, this formula would tell one the best way of estimating an individual’s y score based on that individual’s x score. For example, if we want to predict math achievement for a similar group knowing only grades in h.s., we could use the regression equation to estimate an individual’s achievement score; predicted math achievement = .40 + 2.14 x (the person’s grades score). Thus, if a student has mostly Bs (i.e., a code of 6) for their grades, their predicted math achievement score would be 13.24; math achievement = .40 + 2.14 x 6.
One should be cautious in doing this, however; we know that grades in h.s. only explains 24% of the variance in math achievement, so this would not yield a very accurate prediction. A better use of simple regression is to test a directional hypothesis: Grades in h.s. predict math achievement. If one really thinks that this is the direction of the relationship (and not that math achievement leads to grades in h.s.), then regression is more appropriate than correlation.
An Example of How to Write About Output 8.5
Results
Simple regression was conducted to investigate how well grades in high school predict math achievement scores. The results were statistically significant, F(1, 73) = 24.87, p < .001. The identified equation to understand this relationship was math achievement = .40 + 2.14 x (grades in high school). The adjusted R2 value was .244. This indicates that 24% of the variance in math achievement was explained by the grades in high school. According to Cohen (1988), this is a large effect.
Source: Morgan George A, Leech Nancy L., Gloeckner Gene W., Barrett Karen C.
(2012), IBM SPSS for Introductory Statistics: Use and Interpretation, Routledge; 5th edition; download Datasets and Materials.
31 Mar 2023
31 Mar 2023
15 Sep 2022
30 Mar 2023
14 Sep 2022
30 Mar 2023