Now we will Recode mother’s education and father’s education so that those with no postsecondary education (2s and 3s) have a value of 1, those with some postsecondary will have 2, and those with a bachelor’s degree or more will have a value of 3.
It is usually not desirable to dichotomize (divide into two categories) or trichotomize (divide into three categories) an ordinal or, especially, a normal/scale variable in which all of the levels are ordered correctly and are meaningfully different from one another. However, we need an independent variable with a few levels or categories to demonstrate certain analyses later, and these variables seem to have a logical problem with the ordering of the categories/values. The problem can be seen in the codebook. A value of 5 is given for 2 years of vocational/community college (and presumably an associate’s degree), but a 6 is given to a parent with less than 2 years of (a 4-year) college. Thus, we could have a case where a parent who went to a 4-year college for a short time would be rated as having more education than a parent with an associate’s degree. This would make the variable not fully ordered.
Recodes also are used to combine two or more small groups or categories of a variable so that group size will be large enough to perform statistical analyses. For example, we have only a few fathers or mothers who have a master’s or doctorate so we will combine them with bachelor’s degrees and call them “B.S. or more.”
Recode mother’s and father’s education so that those with no postsecondary education have a value of 1, those with some postsecondary education have a value of 2, and those with a bachelor’s degree or more have a value of 3. Label the new variables and values. Also print the frequency distributions for maed and faed.
Follow these steps:
- Click on Transform → Recode Into Different Variables and you should get Fig. 5.4.
- Now click on mother’s education and then the arrow
- Click on father’s education and the arrow to move them to the Numeric Variables ^ Output
- Now highlight faed in the Numeric Variable box so that it changes color.
- Click on the Output Variable Name box and type faedRevis.
- Click on the Label box and type father’s educ revised.
- Click on Change. Did you get faed → faedRevis in the Numeric Variable → Output Variable box as in Fig. 5.4?
Now repeat these procedures with maed in the Numeric Variable → Output box.
- Highlight
- Click on Output Variable Name, type maedRevis.
- Click Label, type mother’s educ revised.
- Click Change.
- Then click on Old and New Values to get Fig. 5.5.
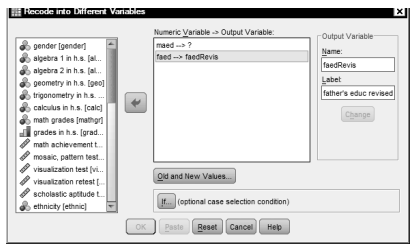
Fig. 5.4. Recode into different variables.
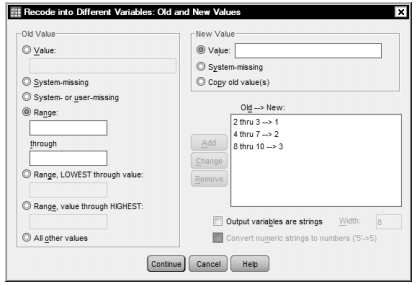
Fig. 5.5. Recode.
- Click on Range and type 2 in the first box and 3 in the second box.
- Click on Value (part of New Value on the right) and type 1.
- Then click on Add.
- Repeat these steps to change old values 4 through 7 to a new Value of
- Then Range: 8 through 10 to Value: 3. Does it look like Fig. 5.5?
- If it does, click on Continue.
- Finally, click on OK.
Check your Data View to see if faedRevis and maedRevis, with numbers ranging from 1 to 3, have been added on the far right side. To be extra careful, check the data file for a few participants to be sure the recodes were done correctly. For example, the first participant had 10 for faed, which should be 3 for faedRevis. Is it? Check a few more to be sure or compare your syntax file with the one in Output 5.2 below.
- Now, we will label the new (1, 2, 3) values.
- Go to your hsbdata file and click on Variable View (it is in the bottom left corner).
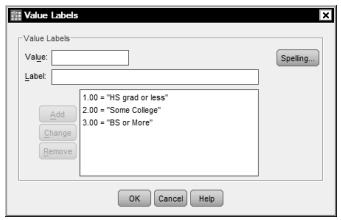
- In the faedRevis variable row, click on None under the Values column and then ] to get Fig. 5.6.
- Click on the Value box and type 1.
- Type HS grad or less where it says Label.
- Click on Add.
- Then click on the Value box again and type 2.
- Click on the Label box and type Some College.
- Click on Add.
- Click once more on the Value box and type 3.
- Click on the Label box and type BS or More.
- Again, click on Add. Does your window look like Fig. 5.6? If so,
- Click on OK.
Important: You have only labeled faedRevis (father’s educ revised). You need to repeat these steps for maedRevis. Do Value Labels for maedRevis on your own.
Now that you have recoded and labeled both faedRevis and maedRevis, you are ready to run a frequency distribution for them as you did for other variables in Problem 4.5. (See that problem for commands.)
Source: Morgan George A, Leech Nancy L., Gloeckner Gene W., Barrett Karen C.
(2012), IBM SPSS for Introductory Statistics: Use and Interpretation, Routledge; 5th edition; download Datasets and Materials.
15 Sep 2022
27 Mar 2023
19 Sep 2022
16 Sep 2022
19 Sep 2022
16 Sep 2022