Consumers buy goods because the purchase makes them better off. Consumer sur- plus measures how much better off individuals are, in the aggregate, because they can buy goods in the market. Because different consumers place different values on the consumption of particular goods, the maximum amount they are willing to pay for those goods also differs. Individual consumer surplus is the difference between the maximum amount that a consumer is willing to pay for a good and the amount that the con- sumer actually pays. Suppose, for example, that a student would have been willing to pay $13 for a rock concert ticket even though she only had to pay $12. The $1 dif- ference is her consumer surplus.7 When we add the consumer surpluses of all con- sumers who buy a good, we obtain a measure of the aggregate consumer surplus.
1. Consumer Surplus and Demand
Consumer surplus can be calculated easily if we know the demand curve. To see the relationship between demand and consumer surplus, let’s examine the individual demand curve for concert tickets shown in Figure 4.14. (Although the following discussion applies to this particular individual demand curve, a similar argument also applies to a market demand curve.) Drawing the demand curve as a staircase rather than a straight line shows us how to measure the value that our consumer obtains from buying different numbers of tickets.
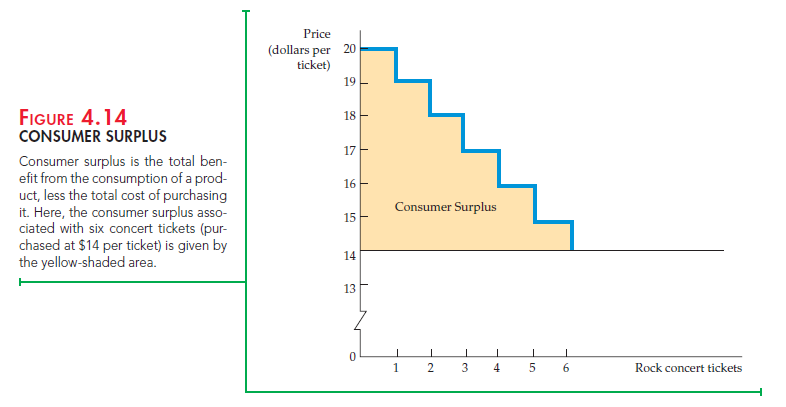
When deciding how many tickets to buy, our student might reason as follows: The first ticket costs $14 but is worth $20. This $20 valuation is obtained by using the demand curve to find the maximum amount that she will pay for each additional ticket ($20 being the maximum that she will pay for the first ticket). The first ticket is worth purchasing because it generates $6 of surplus value above and beyond its cost. The second ticket is also worth buying because it generates a surplus of $5 ($19 – $14). The third ticket generates a surplus of $4. The fourth, however, generates a surplus of only $3, the fifth a surplus of $2, and the sixth a surplus of just $1. Our student is indifferent about purchasing the seventh ticket (which generates zero surplus) and prefers not to buy any more than that because the value of each additional ticket is less than its cost. In Figure 4.14, consumer surplus is found by adding the excess values or surpluses for all units purchased. In this case, then, consumer surplus equals
$6 + $5 + $4 + $3 + $2 + $1 = $21
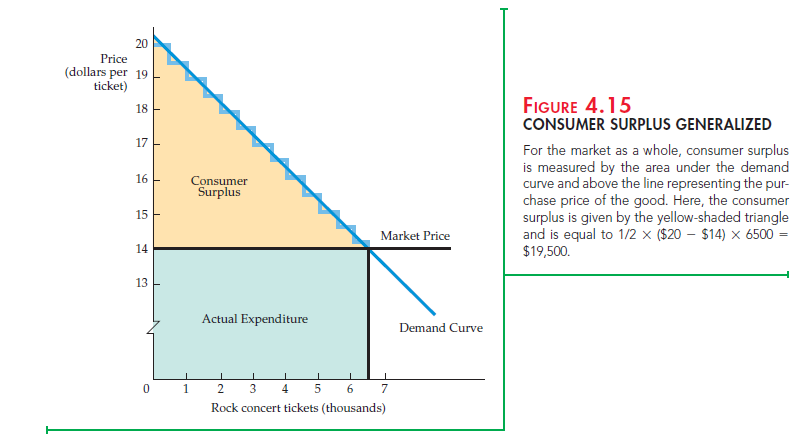
To calculate the aggregate consumer surplus in a market, we sim- ply find the area below the market demand curve and above the price line. For our rock concert example, this principle is illustrated in Figure 4.15. Now, because the number of tickets sold is measured in thousands and individuals’ demand curves differ, the market demand curve appears as a straight line. Note that the actual expenditure on tickets is 6500 X $14 = $91,000. Consumer surplus, shown as the yellow-shaded triangle, is
1/2 * ($20 – $14) * 6500 = $19,500
This amount is the total benefit to consumers, less what they paid for the tickets. Of course, market demand curves are not always straight lines. Nonetheless, we can always measure consumer surplus by finding the area below the demand curve and above the price line.
APPLYING CONSUMER SURPLUS Consumer surplus has important applica- tions in economics. When added over many individuals, it measures the aggregate benefit that consumers obtain from buying goods in a market. When we combine consumer surplus with the aggregate profits that producers obtain, we can eval- uate both the costs and benefits not only of alternative market structures, but of public policies that alter the behavior of consumers and firms in those markets.
Source: Pindyck Robert, Rubinfeld Daniel (2012), Microeconomics, Pearson, 8th edition.
I visited a lot of website but I think this one has got something extra in it in it
I got what you intend,bookmarked, very decent site.