When designing the control system, there are certain helpful guidelines to keep in mind. For instance, the primary purpose of the control system is to correct error, not to identify and punish the guilty. Managers must realize that the past cannot be changed, no matter how loudly they yell. Moreover, investment in the control system is subject to sharply diminishing returns. The cost of control increases faster and faster while the degree of control—and its value—increases more and more slowly.
We could, if we wished, control the quality of “hardware store” type wooden yardsticks, so that they were accurate to 1/10,000th of an inch. But who cares? Moreover, who would be willing to invest the increased cost in a product that is usually given away as a gift? Thus, there is some optimum amount of resources worth investing in the control process. The control system should exert control only to the degree required to achieve its objectives; additional control will not help and may be cost-inefficient.
In the same vein, as the degree of control increases beyond some difficult-to-define point, innovation and creativity are discouraged until they are finally shut off completely. In general, the control system should employ the lowest degree of hassle consistent with accomplishing its goals. It is best to avoid annoying those people whose cooperation is needed to reach project goals. To summarize, the control system should be cost-effective and should operate with the minimum force required to achieve the desired end results.
There are three primary mechanisms by which the PM exerts control: process reviews, personnel assignment, and resource allocation. The process review is directed to an analysis of the process of reaching the project objectives rather than on the results, per se. Because results are largely dependent on the process used to achieve them, the process can be subjected to control even if the results cannot. On R&D projects, for example, project team members usually cannot be held responsible for research or technological outcomes, but they can certainly be held responsible for adherence to the proposal, the budget, and the schedule. Care must be taken, however, not to overstress methods as opposed to results; although methods are controllable, it is still the results that count.
As an example of the effective use of process controls, Australia’s 7-year Parliament House construction project matched the inherent construction complexity with an equally sophisticated set of schedule, cost, and time controls. The time controls, for instance, included four levels of increasing detail that could be accessed during progress review and coordination meetings (Nixon, 1987).
Control can also be exercised through personnel assignments based on past project productivity. Although it is relatively easy to separate workers in the top and bottom quartiles by measuring performance or productivity, separating the middle two quartiles is much more difficult, so this approach should be used carefully. Moreover, reassignment can have drawbacks in terms of creating elite groups of top producers but demotivating everyone else in the system.
Controlling resource allocation can be a powerful motivator—and demotivator. Resources are usually allocated to the more productive or important tasks and this can significantly influence the attainment of project results. (Remember that all tasks in a project must be completed to complete the project.) As in the use of other control techniques, the PM needs to exercise care when making decisions about which tasks need the resources in the future, regardless of past efficiencies.
There are some common mistakes PMs and other organizational managers make when trying to control projects. For example, when controlling processes, there is the danger of emphasizing short-run results at the expense of long-run objectives. Excessive control directed to specific objectives can result in sacrificing other project objectives. Across-the-board cuts in resource allocations tend to reward those who have already overspent or overhired while penalizing the frugal and efficient. Finally, focusing on certain items for control can distract the attention of team members from other, equally important items: “What isn’t counted, doesn’t count.” There is hardly a community in the United States that has not adopted a set of standardized tests to measure the learning of school children. The salaries of teachers are affected by these test results. It should, therefore, hardly come as a shock to the public that teachers spend considerable time and effort “teaching to the test.”
1. Types of Control Systems
The process of controlling a project, or any other system, is more complex than might be expected. Decisions must be made concerning where in the project we will try to exert control, what is to be controlled, how it will be measured, and how much deviation from plan will be tolerated before we intercede. It is helpful in making these decisions first to understand thoroughly the primary types of control systems used by project managers: go/ no’go controls and post’control.
The go/no-go control takes the form of tests (sensors) to determine if some specific precondition (standard and comparator) has been met before permission is granted to continue (decision maker and effector). This type of control can be used on almost every aspect of a project. The project plan, budget, schedule, earned value charts, and other such information can all operate as control documents. In addition, the PM has prespecified project milestones as control checkpoints. The PM can intercede at any level of the project tasks and subtasks for which detail is available in these control documents.
The “phase-gate” method of monitoring and control (also known as “quality gate,” “toll gate,” and other names) often makes use of the natural milestones in a project as phase gates, though some may be ignored or other phases added. The preconditions to pass each gate are specified beforehand so upper management will not be tempted to let a project slip by without a thorough evaluation, the result of which could be approval to proceed, an order for additional resources, a change in direction, or the termination of the project.
It is worth repeating that a primary aim of the PM is to intercept problems before they arise—at least before they get serious—so it is worthwhile for the PM to include an early warning system with the control system. In this way, potential problems can be exposed and dealt with before they turn into full-blown disasters. Because any project early warning system will include people, it is important for the PM to make it known that the messenger who brings bad news will not be shot, but anyone who sweeps bad news or problems under the rug will be!
An example of a status report used by the agricultural products division of a large chemical company for go/no-go control is illustrated in Figure 7-4. As can be seen, some of the tasks are completed, some are in progress, and some have not yet started. Details from the PM or additional reports about those tasks completed and in progress are used to make the go/no-go decisions.
Post-controls, also known as postperformance reviews, are applied after the project has been completed. Although it might appear that this is the legendary situation of locking the barn door after the horse has been stolen, it is not. The purpose here is not to control the already completed project, but to allow future projects to learn and profit from past project experience. Such lessons might include information about certain suppliers, cost-estimating procedures, or even ways of improving the process of managing projects. Certain managerial methods, organizational procedures, or processes might be altered for future projects, resulting in greater predictability and control and, one hopes, better performance, cost, or schedule results.
The earlier the PM can intercede in a problem, the more likely the project team will be able to correct its activities, but humans respond to these controls in different ways. Response to go/no-go controls tends to be neutral. Because there is no gradation between excellent and barely acceptable, or between terrible and just unacceptable, the fine line of acceptability thus becomes a very sharp knife, subject to complaint and irritation. In a project, however, criticism tends to be leveled toward the team instead of the individual so the response is often less severe than it might have been otherwise.

We have already described some of the tools that can help the PM in designing and applying the control system: variance analysis, trend projections, and earned value analysis. With trend projection, for instance, the PM can plot a budget, plan, or growth curve as shown in Figure 7-5 and then, as actual values come in with project progress, plot these as a dashed line on the same chart. Using the dashed line, the PM can forecast on a continuing basis what the projected completion will be. Based on the projection, the PM can decide if there is a problem, what alternatives exist for control, what they will cost and require, and what they will achieve.
Another useful tool for a PM is the critical ratio. A critical ratio indicates to a manager when a task or process is becoming unacceptable, typically when the ratio drops below 1. By tracking the ratio, the manager can anticipate when a problem may be brewing. The calculation of the critical ratio for project tasks is the product of a schedule ratio and a cost ratio. The schedule ratio is actual progress divided by scheduled progress, as measured by some common standard such as earned value: EV/PV. Clearly, ratios greater than one are desirable. The cost ratio is budgeted cost divided by actual cost, or if earned value data are available, EV/AC. Again, values greater than one are most desirable. Taking the product of these two ratios thus gives us an overall measure that includes performance, cost, and schedule.
CR = (actual progress/scheduled progress) x (budgeted cost/actualcost)
Note that the two ratios are equally important in the calculation of the critical ratio. If one ratio is bad, it can be offset by the other ratio if it is equally good. For example, if the actual progress is 2 and the scheduled progress is 3, resulting in a schedule ratio of 2/3, and the budgeted cost is 6 and the actual cost is 4, resulting in a cost ratio of 3/2, their product, 2/3 x 3/2 = 1. Thus, although the project is behind schedule, the cost is correspondingly below budget so everything is fine if lateness is no problem for this activity. This may not really be acceptable to the PM, so a wise PM will evaluate the components of a critical ratio as well as the overall value. Remember that the measurement of progress is subject to the same warnings we noted in the discussion of earned value.
Similar calculations are given in Table 7-3 where the above example is an illustration of Task Number 1. Task 2 is on budget but progress is lacking, so too much money was spent than should have been spent; when the project is completed, it will probably go over budget. Similarly, Task 3 is on schedule but is over budget, creating another probable cost overrun. The critical ratios for Tasks 4 and 5 both exceed 1.0, and none of the subratios is a problem. Task 4 is ahead of schedule and on budget, and Task 5 is on schedule and below budget. The PM may want to look further into these happy events to see what is going on, or if the monitoring system is reporting accurately.

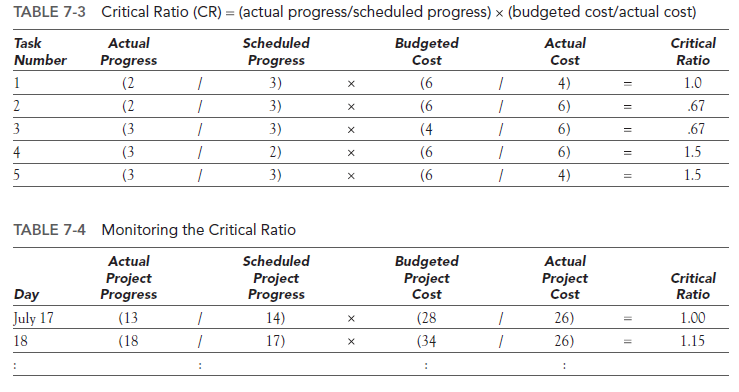
Beyond evaluating each of the activities of a project, a critical ratio for the project as a whole can be calculated as well, as illustrated in Table 7-4. Here, the project is assumed to consist of the five tasks in Table 7-3 and the values of each element of the critical ratio are summed on a daily basis with the critical ratio calculated for each day. This ratio can then be itself tracked in a table (see Table 7-4 where the first day is from Table 7-3) and plotted on a control chart. The PM can also set some “control limits” for the critical ratio so that if they are exceeded on the upside or downside, an investigation is in order, as shown in Figure 7-6. Different tasks, of course, may warrant different control limits. Further, the upside limits may be different, probably larger, than the downside (problem) limits.
Dealing with such differences is the purpose of another tool, the control chart. Any measure—the volume of raw material being used, the cost of contract labor in the project, the hours of computer time—can be plotted and tracked on a control chart such as that shown in Figure 7-7. As illustrated, control limits for intervention can be set by the PM and shown on the chart, so that when a measure exceeds one of these limits, action is instigated.
Another recent development, benchmarking, can be a useful tool for a PM when designing a monitoring and control system (Christensen, 1994; Gupta and Graham, 1997; Ibbs and Kwak, 1998; Thamhain, 1996; Toney, 1997). The process here is to make comparisons to “best in class” practices across organizations, or divisions, or even departments within an organization. An example is a benchmarking study (Ibbs and Kwak, 1998) to generate data for a Project Management Maturity Model. The model measures project processes, tools, techniques, and practices across a range of industries, the various lifecycle phases, and the ten knowledge areas of PMBOK.


An example of an internal benchmarking study was Johnson Control’s benchmarking of the project management procedures of their own highly successful product development project managers, to be used by less-successful project managers. They identified four common sets of procedures these successful PMs all used. These procedures are now used to train new employees, standardize practices, create a common language, tie together company functions, and create a positive project management culture (Reith and Kandt, 1991). Benchmarking and the control chart are tools commonly used in quality management, a subject discussed in more detail in Chapter 8 of PMBOK. (See also Meredith and Shafer, 2016.)
2. Burnup and Burndown Charts
Burnup and burndown charts are relatively new additions to the PM’s arsenal of tools to help monitor and control overall project progress. Their popularity stems from increased interest in Agile project management approaches as well their intuitive nature. A burn- down chart is created with scope on the vertical axis and time on the horizontal axis. The remaining work that needs to be completed to finish the project at various points in time is plotted on the chart which creates a downward sloping line. The slope of the plotted line corresponds to the rate of progress with a steeper line being associated with a greater rate of progress. Based on an estimate of the future slope of the line, the time of project completion can be estimated.
While a burnup chart contains the same axes as the burndown chart, two different lines are plotted on it. The first set of data plotted is the amount of work completed to date, and the second set of data is the total amount of work, including scope changes, yet to now be completed. Both burnup and burndown charts provide the PM with a straightforward approach for monitoring and communicating overall project progress. The choice of one chart versus the other is a matter of personal preference.
Source: Meredith Jack R., Mantel Jr. Samuel J., Shafer Scott M., Sutton Margaret M. (2017), Project Management in Practice, John Wiley & Sons, Inc. 3th Edition.
As a Newbie, I am always browsing online for articles that can be of assistance to me. Thank you