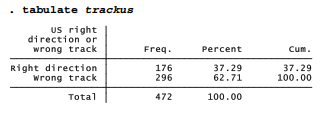
The summary statistics, graphs and transformations described above apply mainly to measurement variables. Categorical variables require different approaches, often starting with simple one- or two-way tables. For examples using such tables we return to the Granite State Poll data, Granite2011_6.dta. One question (trackus) asked whether people think the U.S. is headed in the right direction, or is on the wrong track. Although this question appears vague and strangely worded it has a long tradition among pollsters, having been used successfully on hundreds of surveys as a barometer of public mood. A majority on this New Hampshire poll expressed pessimism:
tabulate can produce frequency distributions for variables that have thousands of values. To construct a manageable frequency distribution table for a variable with many values, however, you might first want to group those values by applying generate with its recode or autocode options (see Chapter 2 or help generate).
tabulate followed by two variable names creates a two-way cross-tabulation. For example, here is a cross-tabulation of trackus by educ (respondent’s level of education):
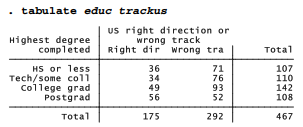
The first-named variable forms the rows, and the second forms columns in the resulting table. We see that 71 of the 107 respondents with high-school education or less believe the U.S. is on the wrong track.
Are trackus opinions related to education? To find out we can run a %2 (chi-squared) test and examine row percentages, because educ, which defines the rows, is our independent variable here. The row option asks for row percentages; nof means no frequencies should be shown.
. tabulate educ trackus, row nof chi2

Sixty-nine percent of respondents with technical school or some college believe the U.S. is on the wrong track. Those with postgraduate degrees appear more optimistic; only 48% hold this view. Based on this sample, we can reject the null hypothesis that educ and trackus are unrelated in the New Hampshire population (/2 = 12.75, p = .005).
tabulate has a number of options that are useful with two-way tables. These include alternative tests (Fisher’s exact test; likelihood-ratio %2 ) and measures of association (Goodman and Kruskal’s y (gamma), Kendall’s Tb (tau-b) and Cramer’s V). The option missing requests that missing values be included among the rows or columns of the table. tabulate can also save frequencies and variables names as matrices. Type help tabulate for list of options with details.
Occasionally we might need to re-analyze a published table, without access to the original raw data. A special command, tabi (immediate tabulation), accomplishes this. Type the cell frequencies on the command line, with table rows separated by “ \ ”. For illustration, here is how tabi could reproduce the previous cross-tabulation directly from the four cell frequencies without need for any dataset:

Unlike tabulate, tabi does not require or refer to any data in memory. By adding the replace option, however, we can ask tabi to replace whatever data are in memory with the new crosstabulation. Statistical options (chi2, exact, nofreq and so forth) work the same for tabi as they do with tabulate; see help tabulate twoway.
None of the examples in this section so far involve weighting. As described in Chapter 4, survey researchers often do apply weights, carefully calculated to make sample results more representative of a target population. The variable censuswt provides such weights for the Granite State Poll. Earlier, we used a svyset command to declare these as probability weights.
. syvset [pw = censuswt]
Commands with the svy: prefix will apply the svyset weights automatically; for other commands the weights are ignored. Here are weighted versions of the one and two-way tables above.

In the weighted table we see an even greater difference in pessimism between respondents with technical school or some college (75.5% wrong track) and postgraduate education (46.6% wrong track). Design-based F tests provide the survey counterpart to an unweighted table’s chi- squared test. This F test also agrees that the educ/trackus relationship is statistically significant (p = .0005).
Source: Hamilton Lawrence C. (2012), Statistics with STATA: Version 12, Cengage Learning; 8th edition.
I have not checked in here for a while because I thought it was getting boring, but the last several posts are good quality so I guess I’ll add you back to my daily bloglist. You deserve it my friend 🙂