Economists define three levels of market efficiency, depending on the kinds of information incorporated in security prices. In the first level, prices incorporate all information contained in the record of past prices. This is called weak efficiency. If weak-form efficiency holds, prices follow random walks. We will explain “random walk” in a moment.
The second level of efficiency requires that prices incorporate all public information, including information from the Internet, the financial press, and other public sources. This is called semistrong efficiency. If markets are semistrong efficient, the prices will react immediately to new public information, for example to announcements of earnings per share, a new issue of stock or a merger proposal.
With strong efficiency, prices reflect all the information that can be acquired by painstaking analysis of companies and the economy. In such a market we would observe lucky and unlucky investors, but no superior investors who can consistently beat the market.
We will discuss each level of efficiency in its turn.
1. A Startling Discovery: Price Changes Are Random
As is so often the case with important ideas, the concept of efficient capital markets stemmed from a chance discovery. In 1953, Maurice Kendall, a British statistician, presented a controversial paper to the Royal Statistical Society on the behavior of stock and commodity prices.[1] Kendall had expected to find regular price cycles, but to his surprise they did not seem to exist. Each series appeared to be “a ‘wandering’ one, almost as if once a week the Demon of Chance drew a random number . . . and added it to the current price to determine the next week’s price.” In other words, the prices of stocks and commodities seemed to follow a random walk.
If you are not sure what we mean by “random walk,” you might like to think of the following example: You are given $100 to play a game. At the end of each week a coin is tossed. If it comes up heads, you win 3% of your investment; if it is tails, you lose 2.5%. Therefore, your capital at the end of the first week is either $103.00 or $97.50. At the end of the second week, the coin is tossed again. Now the possible outcomes are:
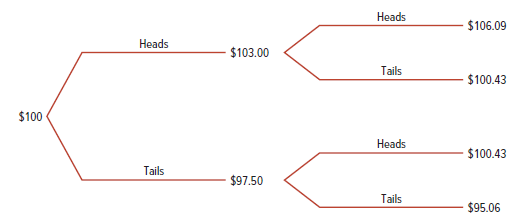
This process is a random walk with a positive drift of .25% per week.[2] It is a random walk because successive changes in value are independent. That is, the odds each week are the same, regardless of the value at the start of the week or of the pattern of heads and tails in the previous weeks.
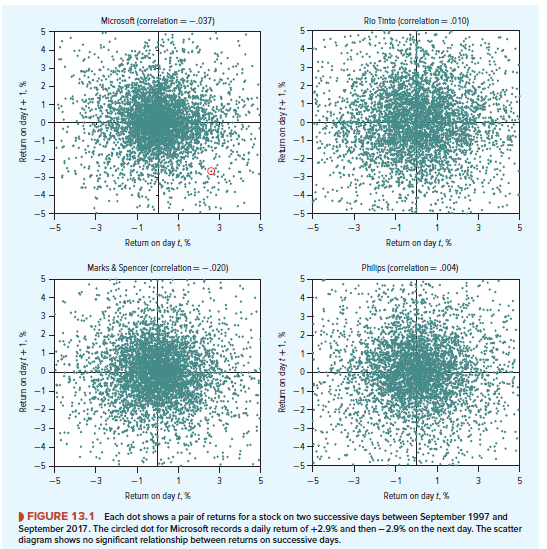
When Maurice Kendall suggested that stock prices follow a random walk, he was implying that the price changes are independent of one another just as the gains and losses in our cointossing game were independent. Figure 13.1 illustrates this for four stocks from different markets —Microsoft, Marks & Spencer, Philips, and Rio Tinto. Each panel shows the change in price of the stock on successive days. The circled dot in the southeast quadrant of the Microsoft panel refers to a pair of days in which a 2.9% increase was followed by a 2.9% decrease. If there were a systematic tendency for increases to be followed by decreases, there would be many dots in the southeast quadrant and few in the northeast quadrant. It is obvious from a glance that there is very little pattern in these price movements, but we can test this more precisely by calculating the coefficient of correlation between each day’s price change and the next. If price movements persisted, the correlation would be positive; if there were no relationship, it would be 0. In our example, the correlation between successive price changes in Microsoft stock was -.037; there was a negligible tendency for price rises to be followed by price falls.[3] For Marks & Spencer, this correlation was also negative at -.020. For Rio Tinto, it was positive at +.010, and for Philips, the correlation was also just positive at +.004.
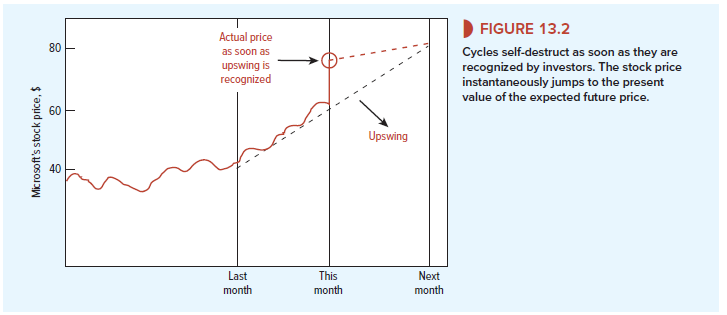
Figure 13.1 suggests that successive price changes of all four stocks were effectively uncorrelated. Today’s price change gave investors almost no clue as to the likely change tomorrow. Does that surprise you? If so, imagine that it were not the case and that changes in Microsoft’s stock price were expected to persist for several months. Figure 13.2 provides an example of such a predictable cycle. You can see that an upswing in Microsoft’s stock price started last month, when the price was $40, and it is expected to carry the price to $80 next month. What will happen when investors perceive this bonanza? It will self-destruct. Since Microsoft stock is a bargain at $60, investors will rush to buy. They will stop buying only when the stock offers a normal risk-adjusted rate of return. Therefore, as soon as a cycle becomes apparent to investors, they immediately eliminate it by their trading.
You should see now why prices in competitive markets must follow a random walk. If past price changes could be used to predict future price changes, investors could make easy profits. But in competitive markets, there are no such free lunches. As investors try to take advantage of any information in past prices, prices adjust immediately until the superior profits from studying price movements disappear. As a result, all the information in past prices will be reflected in today’s stock price, not tomorrow’s. Patterns in prices will no longer exist, and price changes in one period will be independent of changes in the next. In other words, the share price will follow a random walk.
2. Random Walks: The Evidence
Since Maurice Kendall’s early discovery, statisticians have undertaken a myriad of tests of the weak form of the efficient market hypothesis. These have confirmed that stock prices throughout the world follow something close to a random walk. We say “close to a random walk” because every economic theory has its exceptions and there appear to be some patterns in stock returns.
For example, there is statistical evidence for momentum: Stocks that have delivered superior returns over the last few weeks or months tend to deliver superior returns in the future. There is also momentum on the downside: Poorly performing stocks tend to continue to disappoint.[4]
Momentum does not generate easy money for investors. It is a statistical tendency, not a sure thing. Also, pursuit of momentum profits sacrifices diversification and increases risk. Nevertheless, some investment funds specialize in momentum strategies, and a few have done well.
There are also some profit opportunities as prices bounce around in the very short run. But to have any chance of making money from such bounces, you need to be a high-frequency trader with one eye on the computer screen and the other on your annual bonus. You will need super-fast computers with algorithms that trade in high volumes with the aim of capturing a few cents per trade.[5]
3. Semistrong Market Efficiency: The Evidence
To test for semistrong efficiency, researchers have examined how stock prices respond to public releases of information—for example, news about earnings or dividends, announcements of mergers or takeovers, or macroeconomic developments. Semistrong efficiency means that stock prices respond to relevant news quickly and completely.
There’s no doubt that stock prices respond quickly to breaking news. Take Volkswagen’s (VW’s) diesel emissions scandal as an example. On Friday, September 18, 2015, the U.S. Environmental Protection Agency (EPA) announced that VW had installed “defeat devices” in several models of diesel cars that reduced emissions only when emissions tests were under way. VW’s stock price dropped immediately from about $160 to about $130 per share. There was another drop to about $110 per share on Monday, when VW admitted that it had sold 11 million cars worldwide with the defeat device. VW lost nearly one third of its stock-market value in two days’ trading.
Another example: CNBC broadcasts a daily Morning and Midday Call that summarizes security-analyst reports and other information about individual stocks. A study of 322 stocks that were discussed in these calls found that positive reports triggered a price increase seconds after the positive news was first broadcast. Investors could make a small profit after expenses only if they were able to buy in the first 15 seconds.[6]
Abnormal Returns The quick response of a stock price to new public information does not prove that the new price is right and completely incorporates the new information. More thorough tests of semistrong efficiency rely on event studies, which examine abnormal returns on samples of stocks that encountered the same type of news release.
Suppose you decide to investigate how stock prices of takeover targets respond when the takeovers are first announced. As a first stab, you could simply calculate the average return on target-company stocks in the days leading up to the announcement and immediately after it. With daily returns on a large sample of targets, the average announcement effect should be clear. There won’t be too much contamination from movements in the overall market around the announcement dates because daily market returns average out to a very small number.[7] The potential contamination increases for weekly or monthly returns, however. In these cases you will usually want to adjust for market movements. For example, you can simply subtract out the return on the market:
Adjusted stock return = return on stock – return on market index
Chapter 8 suggests a refined adjustment based on betas. (Just subtracting the market return assumes that target-firm betas equal 1.0.) This adjustment is called the market model:
Expected stock return = a + β X return on market index
Alpha (a) states how much on average the stock price changed when the market index was unchanged. Beta (fl) tells us how much extra the stock price moved for each 1% change in the market index.[8] Suppose that subsequently the stock price return is r in a month when the market return is rm. In that case, we would conclude that the abnormal return for that month is
![]()
This abnormal return should reflect firm-specific news only.[9]
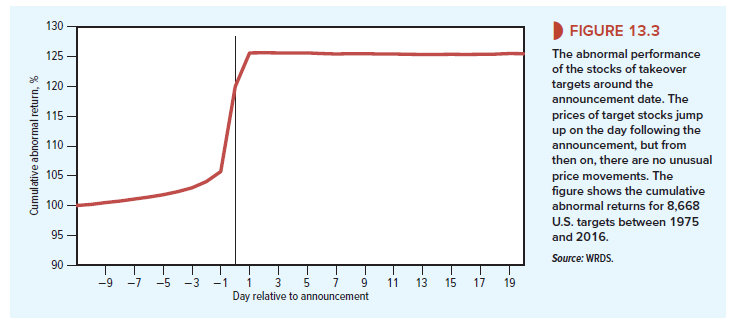
Figure 13.3 illustrates how the release of news affects abnormal returns. It shows the cumulative abnormal return on a sample of U.S. firms that were targets of takeover attempts. Acquiring firms usually have to pay a substantial takeover premium to get the deal done, so the target firm’s stock price increases as soon as the takeover bid is announced. Figure 13.3 shows the average pattern of the target’s stock returns before and after the announcement of a takeover (day 0 in the figure). Stock prices drift up before date zero, as investors gradually realize that a takeover may be coming. On the day of the announcement and the following day, prices jump up by 17.3%.[10] The adjustment to the stock price is immediate and complete. There is no significant further drift in the price, either upward or downward. Thus, within the day, the new stock prices reflect (at least on average) the magnitude of the takeover premium.
Studies of price reactions to takeovers provide good news for semistrong efficiency. But there is also bad news for the hypothesis. One example is the strange case of the “Siamese twins,” two securities with claims on the same cash flows, which nevertheless trade separately. Before the two companies merged in July 2005, the Dutch company Royal Dutch Petroleum and the British company Shell Transport & Trading (T&T) were Siamese twins, each with a fixed share in the profits and dividends of the oil giant. Since both companies participated in the same underlying cash flows, you would expect the stock prices to have moved in exact lockstep. But, as you can see from Figure 13.4, the prices of the two shares sometimes diverged substantially.[11]
4. Strong Market Efficiency: The Evidence
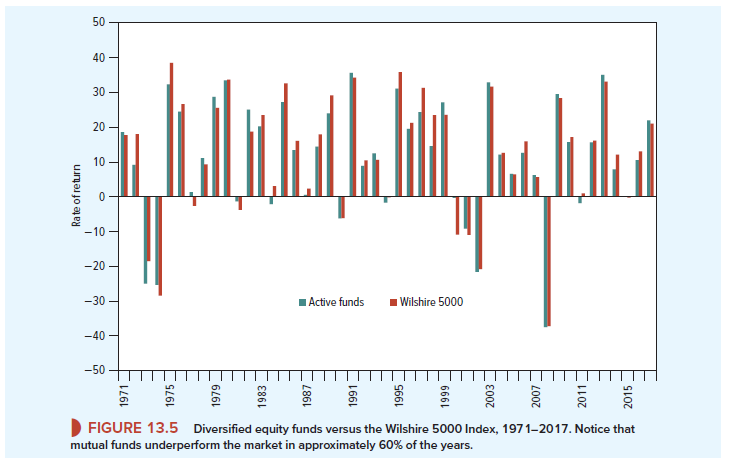
Tests of the strong form of the efficient markets hypothesis have examined whether professional portfolio managers can consistently “beat the market.” Some researchers have found a slight persistent outperformance, but just as many have concluded that professionally managed funds fail to recoup the costs of management. Look, for example, at Figure 13.4, which compares the returns on diversified equity funds to the Wilshire 5000 Index. You can see that in some years, the mutual funds beat the market, but roughly 60% of the time, it was the other way around.
Figure 13.5 provides a fairly crude comparison because mutual funds have tended to specialize in particular sectors of the market, such as low-beta stocks or large-firm stocks, that may have given below-average returns. To control for such differences, each fund needs to be compared with a benchmark portfolio of similar securities. A number of studies have done this. Most have found that the message was unchanged: The funds earned a lower return than the benchmark portfolios after expenses and roughly matched the benchmarks before expenses.
OK, maybe mutual funds in general don’t earn superior returns, but surely some managers are smarter than others and can be relied on to beat their less competent brethren. Unfortunately, it seems difficult to spot the smart ones. For example, a top-quartile fund in one year has no more than an average chance of being in the top quartile the following year.[13] It seems that the top-performing managers in one period have about an average chance of falling on their faces in the next period.
The evidence on efficient markets has convinced many professional and individual investors to give up pursuit of superior performance. They simply “buy the index,” which maximizes diversification and cuts costs to the bone. Individual investors can buy index funds, which are mutual funds that track stock market indexes. There is no active management, so costs are very low. For example, in mid-2018 management fees for the Vanguard 500 Index Fund, which tracks the S&P 500 Index, were .04% per year for investments over $10,000. The size of this fund was $418 billion.
How far could indexing go? Not to 100%: If all investors hold index funds, then nobody will be collecting information, and prices will not respond to new information when it arrives. An efficient market needs some smart investors who gather information and attempt to profit from it. To provide incentives to gather costly information, prices cannot reflect all information.[14] There must be some profits available to allow the costs of information to be recouped. But if the costs are small, relative to the total market value of traded securities, then the financial market can still be close to perfectly efficient.
In some ways, the evidence for strong efficiency is stronger than the evidence for weak or semistrong efficiency. Researchers’ statistical tools find patterns, tendencies and anomalies in stock prices. They find examples of lagged responses to public information. Yet it is exceptionally difficult to generate consistent, superior investment performance. Researchers can beat the market in hindsight. Investors with real money have a much harder time of it.
Strong efficiency has important implications for corporate financial managers, who must often decide how to manage investment portfolios. Two examples: Exelon Corporation, which operates the largest fleet of nuclear power plants in the United States, manages a decommissioning trust earmarked to cover future costs of shutting down and decommissioning its nuclear plants. The value of the trust portfolio was $13.3 billion in 2017. Cummins Inc. has a defined-benefit pension plan and sets aside money to invest to cover future pension payments to retired employees in the U.S. and U.K. Its pension assets in 2017 were $5.1 billion.
How should Exelon and Cummins manage these investments? Should they search for portfolio managers that can consistently deliver superior risk-adjusted returns? The evidence for strong-form efficiency indicates that they would be better off minimizing costs by passive indexing of pension fund or other investment portfolios. More and more corporations are doing just that—at least for investments in U.S. stocks and bonds. But they do hire active managers where inefficiencies are more likely—for example, in developing-country stock markets.[15]
Strong-form efficiency has implications for you also. Most readers of this book will be investors. Will you be an active stock-picker? Or will you diversify and minimize management fees by indexing? If you are an active stock-picker, we hope you have fun doing it.
23 Jun 2021
25 Jun 2021
24 Jun 2021
25 Jun 2021
25 Jun 2021
24 Jun 2021