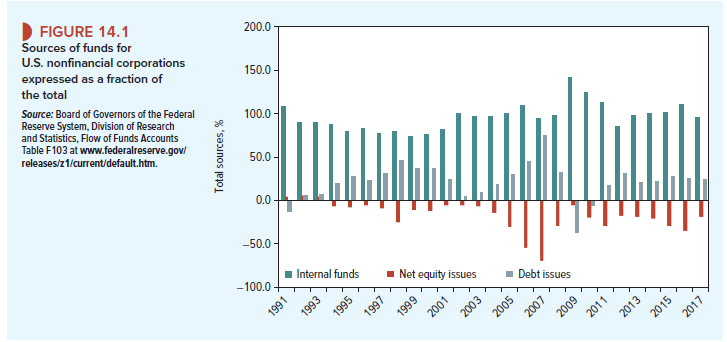
Corporations invest in long-term assets, such as property, plant, and equipment, and in current assets, such as inventory and accounts receivable. Figure 14.1 shows where U.S. corporations get the cash to pay for these investments. Most of the cash is generated internally. That is, it comes from cash flow allocated to depreciation and from retained earnings (earnings not paid out as cash dividends).1 U.S. corporations, together with those in other Anglo-Saxon countries, are unusual in their very heavy reliance on internal finance. However, in most industrial countries depreciation and retained earnings remain the largest source of finance. Shareholders are happy for the cash to be plowed back into the firm, provided that it is invested in positive-NPV projects. Every positive-NPV outlay increases shareholder value.
If internal cash flow is not sufficient to pay for the investments, the company faces a financial deficit. To cover the deficit, the company must cut back on dividends in order to increase retained earnings, or it must raise new debt or equity capital from outside investors. So there are two basic financing decisions. First, what fraction of profits should be plowed back into the business rather than paid out to shareholders? Second, what fraction of the financial deficit should be met with debt rather than equity? Thus, the firm needs a payout policy (Chapter 16) and a debt policy (Chapters 17 and 18).
Take a look at U.S. equity issues in Figure 14.1. Net issues were negative in almost every year. This means that companies paid out more to shareholders by repurchasing shares than they raised by share issues. (Corporations can buy back their own shares, or they may purchase and retire other firms’ shares in the course of mergers and acquisitions.) The choice between cash dividends and repurchases is another aspect of payout policy.
Stock repurchases in the U.S. have typically been larger than new issues of shares. They were especially large in 2006 and 2007, which accounts for the large negative net equity issues in those years. By contrast, debt issues were positive in almost every year.
1. Do Firms Rely Too Much on Internal Funds?
We have seen that, on average, internal funds (retained earnings plus depreciation) cover most of the cash needed for investment. It seems that internal financing is more convenient than external financing by stock and debt issues. But some observers worry that managers have an irrational or self-serving aversion to external finance. A manager seeking comfortable [1]
employment could be tempted to forgo a risky but positive-NPV project if it involved launching a new stock issue and facing awkward questions from potential investors. Perhaps managers take the line of least resistance and dodge the “discipline of capital markets.”
We do not mean to paint managers as loafers. They sometimes have good reasons for relying on internally generated funds. They may seek to avoid the cost of issuing new securities, for example. Moreover, the announcement of a new equity issue is usually bad news for investors, who worry that the decision signals lower future profits or higher risk.[2] If issues of shares are costly and send a bad-news signal to investors, companies may be justified in looking more carefully at those projects that would require a new stock issue.
2. How Much Do Firms Borrow?
The mix of debt and equity financing varies widely from industry to industry and from firm to firm. Debt ratios also vary over time for particular firms. These variations are a fact of life: There is no constant, God-given debt ratio, and if there were, it would change. But a few aggregate statistics will do no harm.
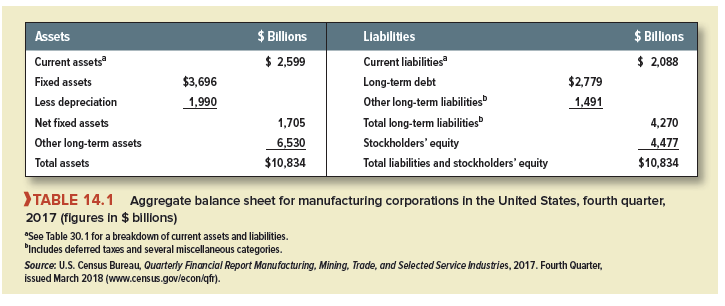
Table 14.1 shows the aggregate balance sheet of all U.S. manufacturing corporations. If all these businesses were merged into a single gigantic firm, Table 14.1 would be its balance sheet. Assets and liabilities in the table are entered at book values, that is, accounting values. These do not generally equal market values. The numbers are nevertheless instructive. Notice that firms had long-term debt of $2,779 billion and equity of $4,477 billion. The ratio of longterm debt to long-term debt plus equity was, therefore, $2,779/($2,779 + $4,477) = .38.[3]
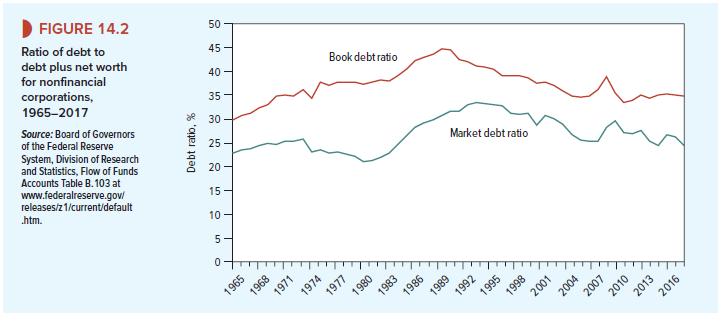
Table 14.1 is, of course, only a snapshot. Figure 14.2 provides a longer-term perspective. The debt ratios are lower when computed from market values rather than book values. This is because the market value of equity is generally greater than the book value.
Figure 14.2 shows that book debt ratios are higher today than 50 years ago. Should we be concerned about this? It is true that higher debt ratios mean that more companies will fall into financial distress when a serious recession hits the economy. But all companies live with this risk to some degree, and it does not follow that less risk is better. Finding the optimal debt ratio is like finding the optimal speed limit. We can agree that accidents at 30 miles per hour are generally less dangerous than accidents at 60 miles per hour, but we do not therefore set the speed limit on all roads at 30. Speed has benefits as well as risks. So does debt, as we see in Chapter 18.
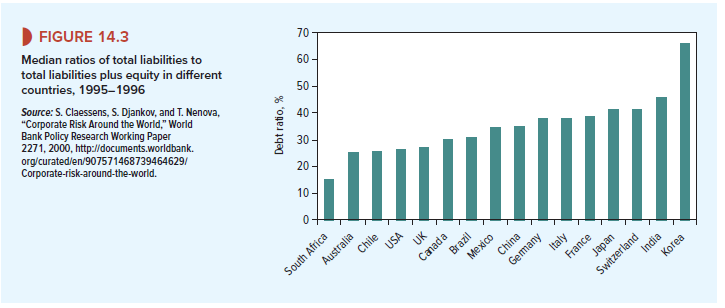
It is interesting to compare debt levels of U.S. companies with those of their foreign counterparts. However, in those countries that do not have well-developed bond markets debt means principally short-term bank debt. Therefore, rather than focusing on just long-term debt, it is more instructive to compare the ratio of total liabilities to total liabilities plus equity. Figure 14.3 is taken from a study by Claessens, Djankov, and Nenova of 11,000 companies in 46 countries. Korean and Indian companies are among the most highly indebted; those in the United States are relatively conservative in their use of debt.
I got what you intend, thanks for posting.Woh I am lucky to find this website through google.
It’s actually a great and useful piece of info. I am glad that you shared this helpful information with us. Please keep us up to date like this. Thanks for sharing.