How do you decide which of the many possible inferential statistics to use? Although this section may seem overwhelming at first because many statistical tests are introduced, don’t be concerned if you don’t now know much about the tests mentioned. You should come back to this chapter later, from time to time, when you have to make a decision about which statistic to use, and by then, the tests will be more familiar. We present eight steps, shown in Fig 6.1, to help guide you in the selection of an appropriate statistical test. The steps and tables are our recommendations; you will see there are often other appropriate choices.

Fig. 6.1. A decision tree to help you select the appropriate inferential statistic from Tables 6.1 to 6.4 (IV = independent variable; DV = dependent variable).
Remember that difference questions compare groups and utilize the statistics that we call difference inferential statistics. These statistics (e.g., t test and ANOVA) are shown in Tables 6.1 and 6.3.
Associational questions utilize what we call associational inferential statistics. The statistics in this group examine the association or relationship between two or more variables and are shown in Tables 6.2 and 6.4.
Using Tables 6.1 to 6.4 to Select Inferential Statistics
As with research questions and hypotheses discussed in Chapter 1, we divide inferential statistics into basic and complex. For basic (or bivariate) statistics, there is one independent and one dependent variable and you will use Table 6.1 or 6.2. For complex statistics, there are three or more variables. We decided to call them complex rather than multivariate, which is more common in the literature, because there is not unanimity about the definition of multivariate, and some statistics with more than two variables (e.g., factorial ANOVA) are not usually classified as multivariate. For complex statistics, you will use Table 6.3 or 6.4. Most of the statistics shown in Tables 6.1 and 6.2 are discussed in the remaining chapters in this book, and text is provided demonstrating how to compute and interpret them.
Two of the complex statistics in Tables 6.3 and 6.4 (factorial ANOVA and multiple regression) are introduced in this book, but they and other such complex statistics are discussed in more detail in our IBM SPSS for Intermediate Statistics book (Leech, Barrett, & Morgan, 4th ed. in press). The statistics are identified with I.B. (i.e., intermediate book) in the tables. These four tables include most of the inferential statistics that you will encounter in reading research articles. Note the boxes in the decision tree are numbered to correspond to the numbers in the text below, which expands somewhat on the decision tree.
- Decide how many variables there are in your research question or hypothesis. If there are only two variables, use Table 6.1 or 6.2. If there is more than one independent and/or dependent variable (i.e., three or more variables) to be used in this analysis, use Table 6.3 or 6.4.
Basic (Two Variable) Statistics
- If the independent variable is nominal (i.e., has unordered levels) or has a few (2 – 4) ordered levels, use Table 6.1. Then your question is a basic two variable difference question to compare groups. You must then determine: (a) whether there are two or more than two levels (also called categories or groups or samples) of your independent variable, (b) whether the design is between groups or within subjects, and (c) whether the measurement level of the dependent variable is (i) normal/scale and parametric assumptions are not markedly violated or (ii) ordinal or (iii) nominal or dichotomous (see Chapter 3 if you need help). The answers to these questions lead to a specific box and statistic in Table 6.1. For example, if there are three levels of the independent variable, if the design is between groups (i.e., these are different unrelated participants in the three groups), and if the dependent variable is normally distributed, the appropriate statistic is one-way ANOVA (analysis of variance), which is shown in the top row, second box from the right, and discussed in Chapter 10. Examples of how to select and interpret inferential statistics are also provided at the end of this chapter.
- If both variables are nominal or dichotomous, you could ask either a difference question (use the bottom row of Table 6.1; e.g., chi-square) or an associational question and use the bottom row of Table 6.2 to select phi or Cramer’s Note, in the second to bottom row of Table 6.2, we have included eta, an associational statistic used with one nominal and one normal or scale variable. Later we will see it used as an effect size measure with ANOVAs. There are many other nonparametric associational measures, some of which we will see in the next chapter.
- If both variables have many (we suggest five or more) ordered levels, use Table 6.2 (top two rows). Your research question would be a basic two variable (bivariate) associational question. Which row you use depends on both If both are normal/scale, then you would probably select the Pearson product moment correlation or bivariate regression (top row). Regression should be used if one has a clearly directional hypothesis, with an independent and dependent variable. Correlation is chosen if one is simply interested in how the two variables are related. If one or both variables are ordinal (ranks or grossly skewed) or other assumptions are markedly violated, the second row (Kendalls’ tau or Spearman rho) is a better choice.
Table 6.1. Selection of an Appropriate Inferential Statistic for Basic, Two Variable, Difference Questions or Hypothesesa
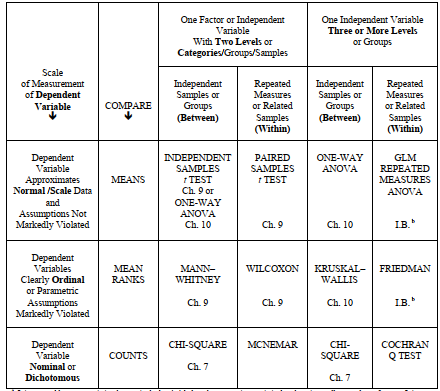
a It is acceptable to use statistics that are in the box(es) below the appropriate statistic, but there is usually some loss of power. It is not acceptable to use statistics in boxes above the appropriate statistic or ones in another column.
b I.B. = Our intermediate book, Leech et al. (in press) IBM SPSS for Intermediate Statistics: Use and Interpretation (4th ed.).
Complex (Three or More Variable) Questions and Statistics
It is possible to break down a complex research problem or question into a series of basic (bivariate) questions and analyses. However, there are advantages to combining them into one
complex analysis; additional information is provided and a more accurate overall picture of the relationships is obtained.
- If you have one normally distributed (scale) dependent variable and two (or perhaps three or four) independent variables, each of which is nominal or has a few (2 – 4) ordered levels, you will use the top row of Table 6.3 and one of three types of factorial ANOVA. These analysis of variance (ANOVA) statistics answer complex difference questions.
Table 6.2. Selection of an Appropriate Inferential Statistic for Basic, Two Variable, Associational Questions or Hypotheses
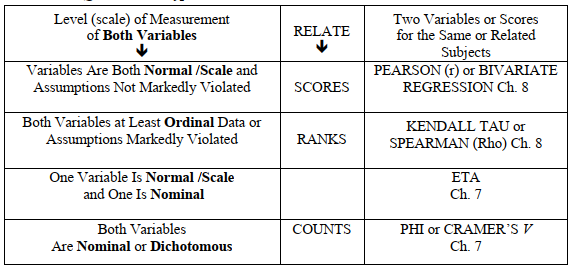
Table 6.3. Selection of the Appropriate Complex (Two or More Independent Variables)
Statistic to Answer Difference Questions or Hypotheses
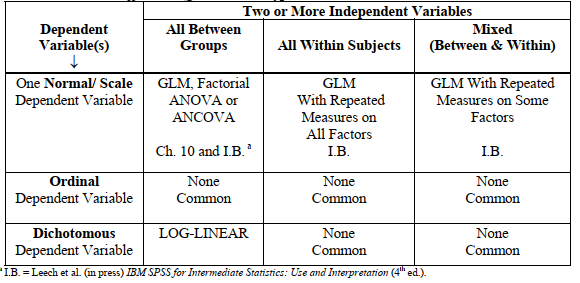
Note, in Table 6.3, that there are no complex difference statistics available in this program if the dependent variable is ordinal. Log-linear analysis is a nonparametric statistic somewhat similar to the between-groups factorial ANOVA for the case where all the variables are nominal or dichotomous (see Table 6.3).
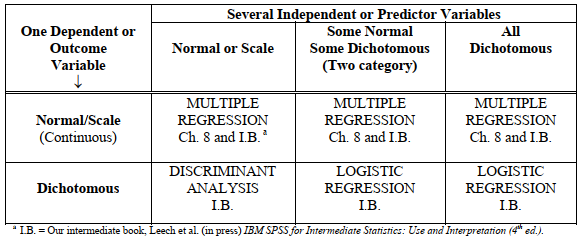
- The statistics in Table 6.4 are used to answer complex associational questions. If you have two or more independent or predictor variables and one normal (scale) dependent variable, the top row of Table 6.4 and multiple regression are appropriate.
- If the dependent variable is dichotomous or nominal, consult the bottom row of Table 6.4, and use discriminant analysis or logistic regression, both discussed in Leech et al. (2005).
- Use a MANOVA if you have two or more normal (scale) dependent variables treated simultaneously.
Exceptions
Occasionally you will see a research article in which a dichotomous dependent variable was used with a t test or ANOVA, or as either variable in a Pearson correlation. Because of the special nature of dichotomous variables, this is not necessarily wrong, as would be the use of a nominal (three or more unordered levels) dependent variable with these parametric statistics. However, we think that it is usually a better practice to use the same statistics with dichotomous variables that you would use with nominal variables. The exception is that it is appropriate to use dichotomous (dummy) independent variables in multiple and logistic regression (see Table 6.4 again).
Table 6.4. Selection of the Appropriate Complex Associational Statistic for Predicting a Single Dependent/Outcome Variable From Several Independent Variables
Source: Morgan George A, Leech Nancy L., Gloeckner Gene W., Barrett Karen C.
(2012), IBM SPSS for Introductory Statistics: Use and Interpretation, Routledge; 5th edition; download Datasets and Materials.
30 Mar 2023
16 Sep 2022
17 Sep 2022
16 Sep 2022
14 Sep 2022
28 Mar 2023