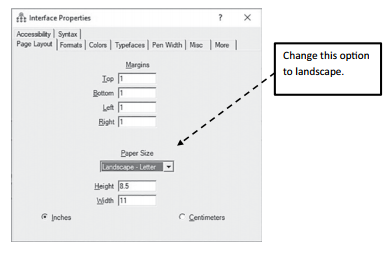
Tip 1: Change the AMOS graphics page from portrait to landscape. In the AMOS graphic win- dow, the program will default with the page in a portrait format. Most models take more space from left to right than from top to bottom. If you change the format of the page to landscape, you have potentially more space to create complex models. To make this change, go to the “View” menu option at the top and then select the “Interface Properties” option. (Here is what the icon for that function looks like ![]() .) After selecting this option, a pop-up window will appear. There are seven tabs at the top of this window that let you change numerous visual options in AMOS. Go to the “Page Layout” tab at the top and then select the paper size option from “Portrait-Letter” to “Landscape-Letter”. This will now rotate your page into a land- scape format.
.) After selecting this option, a pop-up window will appear. There are seven tabs at the top of this window that let you change numerous visual options in AMOS. Go to the “Page Layout” tab at the top and then select the paper size option from “Portrait-Letter” to “Landscape-Letter”. This will now rotate your page into a land- scape format.
Example 3.37:
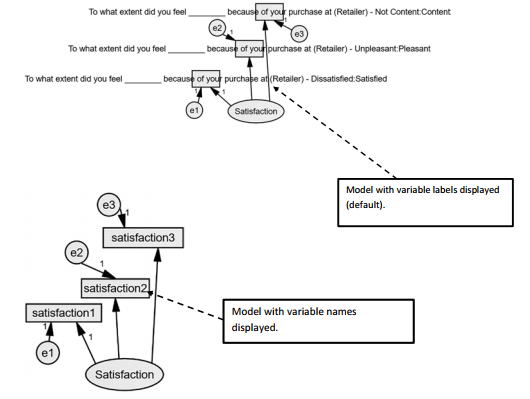
Tip 2: DisplayVariable Names Instead of Labels. When you drag a variable from the variable list into the AMOS graphics window, the variable will be displayed as its label in AMOS. The label is often where you will see the actual question asked in a survey. Hence, instead of just listing a short name for each variable, you have a huge variable label that lists the whole question asked. To have AMOS change from displaying vari- able labels in the graphics window to displaying the variable name, you need to go to the interface properties window. In the tab at the top called “Misc”, you will see a series of checkboxes that are already checked. One of those checkboxes is “Display Variable Labels”.You want to uncheck this box. By doing this, the variable name will now be displayed instead of the label.
Example 3.38:

Tip 3: Have AMOS label all your error terms. If you have a model with numerous constructs and indicators, you will find that it can be quite laborious to label all the error terms for every indicator. AMOS has a function that will label all error terms for you. In the “Plugins” menu option at the top, you need to select “Name Unobserved Variables”.This will label all error terms with a letter “e” and a number. AMOS will start numbering error terms based on the order of creation. The first unobservable construct and error terms created in AMOS will be where the error numbering will start.
A word of caution: this function will try to label unobserved constructs, too, if you have not labeled them already.The unobserved constructs will be labeled a letter “F” and a number. I would not recommend letting AMOS label your unobservable constructs, but I do find this function quite handy in labeling all the error terms in your model.
Example 3.39:

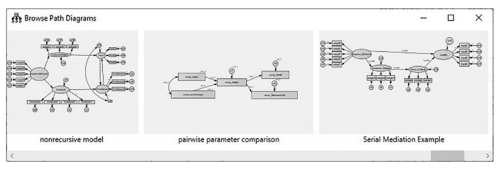
Tip 4: Browse Path Diagrams to find previously saved models. If you are like me, you may have numer- ous versions of a model you are working on and sometimes the name of the saved file does not help me find a specific version of a model.The browse path diagrams function lets you preview previously saved files to find the specific model you desire.To use this function, go to the “File” menu option at the top and then to the “Browse Path Diagram” option.
Example 3.40:
Tip 5: Let AMOS draw covariances between independent variables.All independent variables should have a covariance between them. If you have a large model, this can be quite a few covariances to add. If you select/highlight all the independent unobservable constructs (circles), then go to the “Plugins” menu option at the top and select “Draw Covariances”. This option will draw a covariance between all variables selected/highlighted. It is a good idea to hit the “deselect” button when you are done.
Example 3.41:

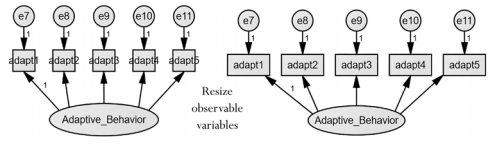
Tip 6: AMOS can resize all observables/indicators to fully show a variable name. The variable names for your indicators can vary wildly in length, and AMOS can help with the resizing of the boxes to fully show the variable names. In the “Plugins” menu at the top, select the “Resize Observed Variables”. This will change the size of all observable variables in the model to fully contain the variable name within the box. Instead of resizing observables/indicators after every construct that is added to the model, you can wait until all constructs are included in the model and use this function to resize all the boxes to fit the variable names.
Example 3.42:
Tip 7: Save the middle of the page for paths/relationships. With full structural models, you can have a lot of indicators and error terms that can really make it hard to see the relation- ships between constructs. Try to keep indicators and error terms near the edge of the page and leave the middle of the page for structural relationships.You will need to rotate indicators around the unobservable constructs to accomplish this.
Example 3.43:
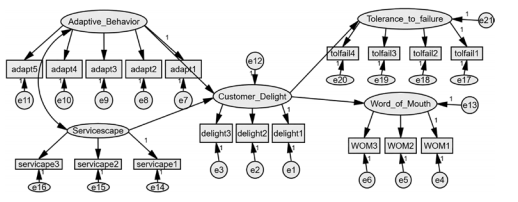
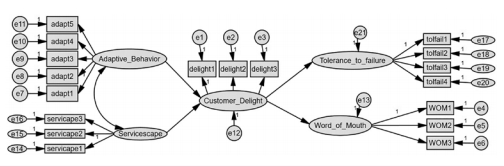
The top model is very busy and hard to see the structural paths because of all the indicators. The bottom model has moved the indicators to the edges of the page so that the structural paths are easier to see.
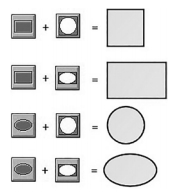
Tip 8: Standardize the look of your observable and unobservable constructs. One way to standardize the look of your observables is to use the “square” function ![]() . If you select the square function and then draw an observable on the graphics window, it will draw every box as a square. Similarly, if the “square” function is selected, ever drawn unobservable will be a perfect circle. There is a subsequent function called “Golden”
. If you select the square function and then draw an observable on the graphics window, it will draw every box as a square. Similarly, if the “square” function is selected, ever drawn unobservable will be a perfect circle. There is a subsequent function called “Golden” ![]() which will create rectangles with observables and ovals with unobservables.
which will create rectangles with observables and ovals with unobservables.
Example 3.44:
Tip 9: Force Objects in the GraphicsWindow to line up on a grid line. If you would like for all of your boxes or circles to be in a straight line down the graphics window, you need to use the option called “Snap Spacing”. In the Interface Properties window, you want to go to the “Misc” tab and then change the Snap Spacing option from “off ” to a number. When snap spacing is turned on, AMOS will include (invisible) grid lines in the graphics window and will space the gridlines out based on your preference. If you choose a snap spacing of 24, then AMOS will separate the grid lines by 24/96 = .25 inches apart. If you select a snap spacing of 12, then the separation is 12/96 = .125 inches apart. To turn the grid lines back off, just change Snap Spacing to “off ”. If you are researcher that likes to have your objects in the graphics window in an orderly pattern, then Snap Spac- ing will save you some time from trying to eyeball objects to be in line with one another.

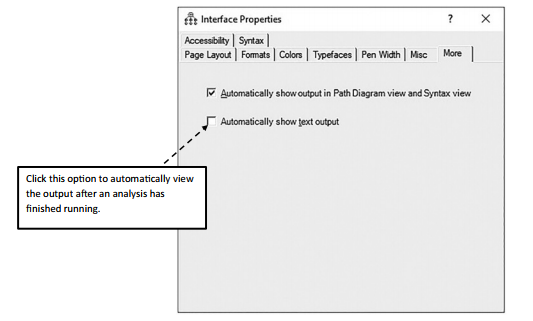
Tip 10:Automatically show text output after running an analysis.After running an analysis,AMOS will require you to select the “View Output” icon ![]() to see your results. The newer version of AMOS will allow the text output to automatically appear after running an analysis. In the Interface Properties option
to see your results. The newer version of AMOS will allow the text output to automatically appear after running an analysis. In the Interface Properties option ![]() , there is a tab at the top of the pop-up window called “More”. Clicking on this tab, you will see an option titled “Automatically show text output”. Clicking this option will allow you to automatically see the output of an analysis without having to select the “View Output” icon.
, there is a tab at the top of the pop-up window called “More”. Clicking on this tab, you will see an option titled “Automatically show text output”. Clicking this option will allow you to automatically see the output of an analysis without having to select the “View Output” icon.
Source: Thakkar, J.J. (2020). “Procedural Steps in Structural Equation Modelling”. In: Structural Equation Modelling. Studies in Systems, Decision and Control, vol 285. Springer, Singapore.
22 Sep 2022
27 Mar 2023
20 Sep 2022
30 Mar 2023
28 Mar 2023
30 Mar 2023