Whereas payback and return on book are ad hoc measures, internal rate of return has a much more respectable ancestry and is recommended in many finance texts. If we dwell more on its deficiencies, it is not because they are more numerous but because they are less obvious.
In Chapter 2, we noted that the net present value rule could also be expressed in terms of rate of return, which would lead to the following rule: “Accept investment opportunities offering rates of return in excess of their opportunity costs of capital.” That statement, properly interpreted, is absolutely correct. However, interpretation is not always easy for long-lived investment projects.
There is no ambiguity in defining the true rate of return of an investment that generates a single payoff after one period:
![]()
Alternatively, we could write down the NPV of the investment and find the discount rate that makes NPV = 0.

Of course C1 is the payoff and -C0 is the required investment, and so our two equations say exactly the same thing. The discount rate that makes NPV = 0 is also the rate of return.
How do we calculate return when the project produces cash flows in several periods? Answer: We use the same definition that we just developed for one-period projects—the project rate of return is the discount rate that gives a zero NPV. This discount rate is known as the discounted cash flow (DCF) rate of return or internal rate of return (IRR). The internal rate of return is used frequently in finance. It can be a handy measure, but, as we shall see, it can also be a misleading measure. You should, therefore, know how to calculate it and how to use it properly.
1. Calculating the IRR
The internal rate of return is defined as the rate of discount that makes NPV = 0. So to find the IRR for an investment project lasting T years, we must solve for IRR in the following expression:
![]()
Actual calculation of IRR usually involves trial and error. For example, consider a project that produces the following flows:
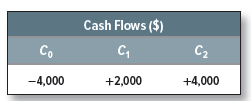
The internal rate of return is IRR in the equation
![]()
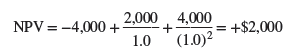
Let us arbitrarily try a zero discount rate. In this case, NPV is not zero but +$2,000:
The NPV is positive; therefore, the IRR must be greater than zero. The next step might be to try a discount rate of 50%. In this case, net present value is -$889:
![]()
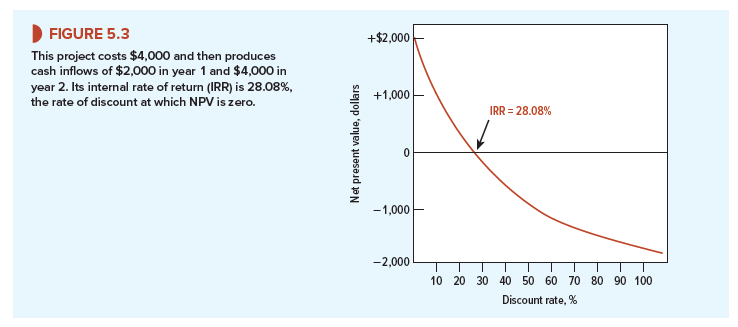
The NPV is negative; therefore, the IRR must be less than 50%. In Figure 5.3, we have plotted the net present values implied by a range of discount rates. From this, we can see that a discount rate of 28.08% gives the desired net present value of zero. Therefore, IRR is 28.08%.
(We carry the IRR calculation to two decimal places to avoid confusion from rounding. In practice, no one would worry about the .08%.)[2]
You can always find the IRR by plotting an NPV profile, as in Figure 5.3, but it is quicker and more accurate to let a spreadsheet or specially programmed calculator do the trial and error for you. The Useful Spreadsheet Functions box near the end of the chapter shows how to use the Excel function to calculate an IRR.
Some people confuse the internal rate of return and the opportunity cost of capital because both appear as discount rates in the NPV formula. The internal rate of return is a profitability measure that depends solely on the amount and timing of the project cash flows. The opportunity cost of capital is a standard of profitability that we use to calculate how much the project is worth. The opportunity cost of capital is established in the financial markets. It is the expected rate of return offered by other assets with the same risk as the project being evaluated.
2. The IRR Rule
The internal rate of return rule states that the firm should accept an investment project if the opportunity cost of capital is less than the internal rate of return. You can see the reasoning behind this idea if you look again at Figure 5.3. If the opportunity cost of capital is less than the 28.08% IRR, then the project has a positive NPV when discounted at the opportunity cost of capital. If it is equal to the IRR, the project has a zero NPV. And if it is greater than the IRR, the project has a negative NPV. Therefore, when we compare the opportunity cost of capital with the IRR on our project, we are effectively asking whether our project has a positive NPV. This is true not only for our example. The rule will give the same answer as the net present value rule whenever the NPV of a project is a steadily declining function of the discount rate.
The 28.08% internal rate of return on our project tells us how high the opportunity cost of capital must be before the project should be rejected. Although we might not be able to put a precise number on the project’s cost of capital, we might nevertheless be confident that it was less than 28.08% and that we can safely go ahead with the project. You can understand, therefore, why a manager may find it helpful to know the project’s IRR. Our worries concern those managers who use the internal rate of return as a criterion in preference to net present value. Although, properly stated, the two criteria are formally equivalent, the internal rate of return rule contains several pitfalls.
3. Pitfall 1—Lending or Borrowing?
Not all cash-flow streams have NPVs that decline as the discount rate increases. Consider the following projects A and B:
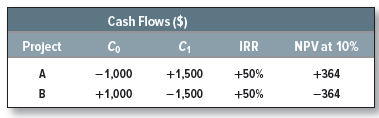
Each project has an IRR of 50%. (In other words, -1,000 + 1,500/1.50 = 0 and +1,000 – 1,500/1.50 = 0.)
Does this mean that they are equally attractive? Clearly not, for in the case of A, where we are initially paying out $1,000, we are lending money at 50%; in the case of B, where we are initially receiving $1,000, we are borrowing money at 50%. When we lend money, we want a high rate of return; when we borrow money, we want a low rate of return.
If you plot a graph like Figure 5.3 for project B, you will find that NPV increases as the discount rate increases. Obviously the internal rate of return rule, as we stated it above, won’t work in this case; we have to look for an IRR less than the opportunity cost of capital.
4. Pitfall 2—Multiple Rates of Return
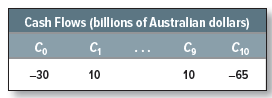
Helmsley Iron is proposing to develop a new strip mine in Western Australia. The mine involves an initial investment of A$30 billion and is expected to produce a cash inflow of A$10 billion a year for the next nine years. At the end of that time, the company will incur A$65 billion of cleanup costs. Thus, the cash flows from the project are:
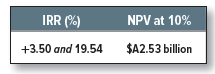
Helmsley calculates the project’s IRR and its NPV as follows:
Note that there are two discount rates that make NPV = 0. That is, each of the following statements holds:
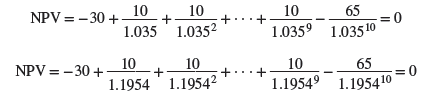
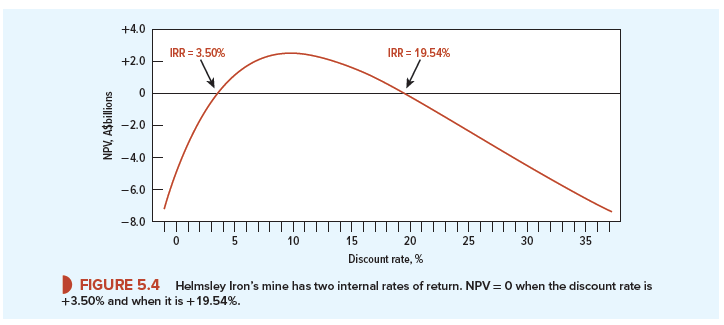
In other words, the investment has an IRR of both 3.50% and 19.54%. Figure 5.4 shows how this comes about. As the discount rate increases, NPV initially rises and then declines. The reason for this is the double change in the sign of the cash-flow stream. There can be as many internal rates of return for a project as there are changes in the sign of the cash flows.4
Decommissioning and clean-up costs can sometimes lead to huge negative cash flows at the end of a project. The cost of decommissioning oil platforms in the British North Sea has been estimated at $75 billion. It can cost more than $500 million to decommission a nuclear power plant. These are obvious instances where cash flows go from positive to negative, but you can probably think of a number of other cases where the company needs to plan for later expenditures. Ships periodically need to go into dry dock for a refit, hotels may receive a major face-lift, machine parts may need replacement, and so on.
Whenever the cash-flow stream is expected to change sign more than once, the company typically sees more than one IRR.
As if this is not difficult enough, there are also cases in which no internal rate of return exists. For example, project C has a positive net present value at all discount rates:
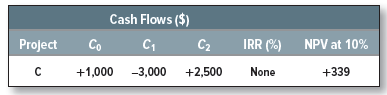
A number of adaptations of the IRR rule have been devised for such cases. Not only are they inadequate, but they also are unnecessary, for the simple solution is to use net present value.
5. Pitfall 3—Mutually Exclusive Projects
Firms often have to choose between several alternative ways of doing the same job or using the same facility. In other words, they need to choose between mutually exclusive projects. Here, too, the IRR rule can be misleading.
Consider projects D and E:
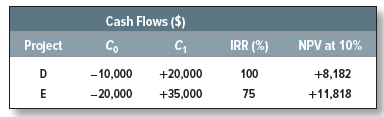
Perhaps project D is a manually controlled machine tool and project E is the same tool with the addition of computer control. Both are good investments, but E has the higher NPV and is, therefore, better. However, the IRR rule seems to indicate that if you have to choose, you should go for D because it has the higher IRR. If you follow the IRR rule, you have the satisfaction of earning a 100% rate of return; if you follow the NPV rule, you are $11,818 richer.
You can salvage the IRR rule in these cases by looking at the internal rate of return on the incremental flows. Here is how to do it: First, consider the smaller project (D in our example). It has an IRR of 100%, which is well in excess of the 10% opportunity cost of capital. You know, therefore, that D is acceptable. You now ask yourself whether it is worth making the additional $10,000 investment in E. The incremental flows from undertaking E rather than D are as follows:
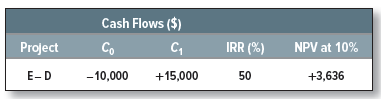
The IRR on the incremental investment is 50%. While that is not as good as D’s IRR, it is well in excess of the 10% opportunity cost of capital. So you should prefer project E to project D.[3]
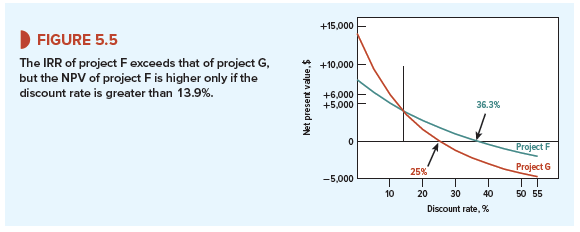
Unless you look at the incremental expenditure, IRR is unreliable in ranking projects of different scale. It is also unreliable in ranking projects with different patterns of cash flow over time. For example, sometimes it can be worth taking a project that offers a good rate of return for a long period rather than one that offers an even higher rate for just a few years. To illustrate, suppose the firm can take project F or project G but not both:
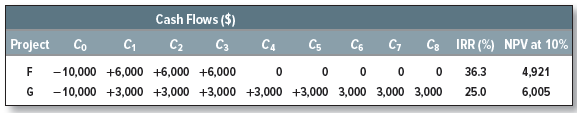
The short-lived project, F, offers the higher IRR, but at a 10% cost of capital, project G has the higher NPV and would therefore make shareholders wealthier.
Figure 5.5 shows how the choice between these two projects depends on the discount rate. Notice that, if investors require a relatively low rate of return (less than 13.9%), they will pay a higher price for project G with its longer life. The short-lived project F is superior only if investors demand a very high rate of return (greater than 13.9%) and therefore place a low value on the more distant cash flows. This is not something you could discover by comparing the project IRRs.
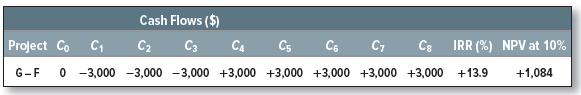
The simplest way to choose between projects F and G is to compare their net present values. But if your heart is set on the IRR rule, you can use it as long as you look at the return on the incremental cash flows. The procedure is exactly the same as we showed earlier. First you check that project F has a satisfactory IRR. Then you look at the return on the incremental cash flows from G.
The IRR on the incremental cash flows from G is 13.9%. Since this is greater than the opportunity cost of capital, you should undertake G rather than F:
6. Pitfall 4—What Happens When There Is More Than One Opportunity Cost of Capital
We have simplified our discussion of capital budgeting by assuming that the opportunity cost of capital is the same for all the cash flows, C1, C2, C3, and so on. Remember our most general formula for calculating net present value:
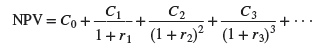
In other words, we discount C1 at the opportunity cost of capital for one year, C2 at the opportunity cost of capital for two years, and so on. The IRR rule tells us to accept a project if the IRR is greater than the opportunity cost of capital. But what do we do when we have several
opportunity costs? Do we compare IRR with ru r2, r3, . . .? Actually we would have to compute a complex weighted average of these rates to obtain a number comparable to IRR.
The differences between short- and long-term discount rates can be important when the term structure of interest rates is not “flat.” In 2017, for example, long-term U.S. Treasury bonds yielded almost 2% more than short-term Treasury bills. Suppose a financial manager was evaluating leases for new office space. Assume the lease payments were fixed obligations. The manager would not use the same discount rate for a 1-year lease as for a 15-year lease.
But the extra precision from building the term structure of discount rates into discount rates for risky capital investment projects is rarely worth the trouble. The gains from accurately forecasting project cash flows far outweigh the gains from more precise discounting. Thus, the IRR usually survives, even when the term structure is not flat.
7. The Verdict on IRR
We have given four examples of things that can go wrong with IRR. We spent much less space on payback or return on book. Does this mean that IRR is worse than the other two measures? Quite the contrary. There is little point in dwelling on the deficiencies of payback or return on book. They are clearly ad hoc measures that often lead to silly conclusions. The IRR rule has a much more respectable ancestry. It is less easy to use than NPV, but, used properly, it gives the same answer.
Nowadays, few large corporations use the payback period or return on book as their primary measure of project attractiveness. Most use discounted cash flow (or DCF), and for many companies, DCF means IRR, not NPV. For “normal” investment projects with an initial cash outflow followed by a series of cash inflows, there is no difficulty in using the internal rate of return to make a simple accept/reject decision. However, we think that the financial managers who like to use IRRs need to worry more about pitfall 3. Financial managers never see all possible projects. Most projects are proposed by operating managers. A company that instructs nonfinancial managers to look first at project IRRs prompts a search for those projects with the highest IRRs rather than the highest NPVs. It also encourages managers to modify projects so that their IRRs are higher. Where do you typically find the highest IRRs? In short-lived projects requiring little up-front investment. Such projects may not add much to the value of the firm.
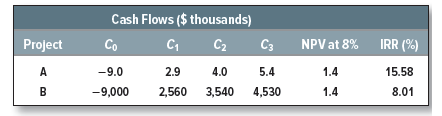
We don’t know why so many companies pay such close attention to the internal rate of return, but we suspect that it may reflect the fact that management does not trust the forecasts it receives. Suppose that two plant managers approach you with proposals for two new investments. Both have a positive NPV of $1,400 at the company’s 8% cost of capital, but you nevertheless decide to accept project A and reject B. Are you being irrational?
The cash flows for the two projects and their NPVs are set out in the accompanying table. You can see that although both proposals have the same NPV, project A involves an investment of $9,000, while B requires an investment of $9 million. Investing $9,000 to make $1,400 is clearly an attractive proposition, and this shows up in A’s IRR of nearly 16%. Investing $9 million to make $1,400 might also be worth doing if you could be sure of the plant manager’s forecasts, but there is almost no room for error in project B. You could spend time and money checking the cash-flow forecasts, but is it really worth the effort? Most managers would look at the IRR and decide that if the cost of capital is 8%, a project that offers a return of 8.01% is not worth the worrying time.
Alternatively, management may conclude that project A is a clear winner that is worth undertaking right away, but in the case of project B, it may make sense to wait and see whether the decision looks more clear-cut in a year’s time.9 That is why managers will often postpone the decision on projects such as B by setting a hurdle rate for the IRR that is higher than the cost of capital.
Thanks , I’ve recently been looking for info approximately this topic for
a while and yours is the best I have discovered till now.
But, what in regards to the conclusion? Are you certain concerning the
source?
Thanks in support of sharing such a nice idea, post is
good, thats why i have read it fully
Great post. I was checking continuously this blog and I am
impressed! Very useful information specifically the last
part 🙂 I care for such info much. I was seeking this particular info for a long time.
Thank you and best of luck.
Way cool! Some very valid points! I appreciate you
penning this article plus the rest of the website is also very good.
Great post.