In many industries, the products are differentiated. For one reason or another, con- sumers view each firm’s brand as different from other brands. Crest toothpaste, for example, is perceived to be different from Colgate, Aim, and other toothpastes. The difference is partly flavor, partly consistency, and partly reputation—the con- sumer ’s image (correct or incorrect) of the relative decay-preventing efficacy of Crest. As a result, some consumers (but not all) will pay more for Crest.
Because Procter & Gamble is the sole producer of Crest, it has monopoly power. But its monopoly power is limited because consumers can easily sub- stitute other brands if the price of Crest rises. Although consumers who prefer Crest will pay more for it, most of them will not pay much more. The typical Crest user might pay 25 or 50 cents a tube more, but probably not one or two dollars more. For most consumers, toothpaste is toothpaste, and the differences among brands are small. Therefore, the demand curve for Crest toothpaste, though downward sloping, is fairly elastic. (A reasonable estimate of the elastic- ity of demand for Crest is −5.) Because of its limited monopoly power, Procter & Gamble will charge a price that is higher, but not much higher, than marginal cost. The situation is similar for Tide detergent or Scott paper towels.
1. The Makings of Monopolistic Competition
A monopolistically competitive market has two key characteristics:
- Firms compete by selling differentiated products that are highly substitut- able for one another but not perfect substitutes. In other words, the cross- price elasticities of demand are large but not infinite.
- There is free entry and exit: It is relatively easy for new firms to enter the market with their own brands and for existing firms to leave if their prod- ucts become unprofitable.
To see why free entry is an important requirement, let’s compare the mar- kets for toothpaste and automobiles. The toothpaste market is monopolistically competitive, but the automobile market is better characterized as an oligopoly. It is relatively easy for other firms to introduce new brands of toothpaste, and this limits the profitability of producing Crest or Colgate. If the profits were large, other firms would spend the necessary money (for development, produc- tion, advertising, and promotion) to introduce new brands of their own, which would reduce the market shares and profitability of Crest and Colgate.
The automobile market is also characterized by product differentiation. However, the large-scale economies involved in production make entry by new firms difficult. Thus, until the mid-1970s, when Japanese producers became important competitors, the three major U.S. automakers had the market largely to themselves.
There are many other examples of monopolistic competition besides toothpaste. Soap, shampoo, deodorants, shaving cream, cold remedies, and many other items found in a drugstore are sold in monopolistically competitive markets. The mar- kets for many sporting goods are likewise monopolistically competitive. So is most retail trade, because goods are sold in many different stores that compete with one another by differentiating their services according to location, availability and expertise of salespeople, credit terms, etc. Entry is relatively easy, so if profits are high in a neighborhood because there are only a few stores, new stores will enter.
2. Equilibrium in the Short Run and the Long Run
As with monopoly, in monopolistic competition firms face downward-sloping demand curves. Therefore, they have some monopoly power. But this does not mean that monopolistically competitive firms are likely to earn large profits. Monopolistic competition is also similar to perfect competition: Because there is free entry, the potential to earn profits will attract new firms with competing brands, driving economic profits down to zero.
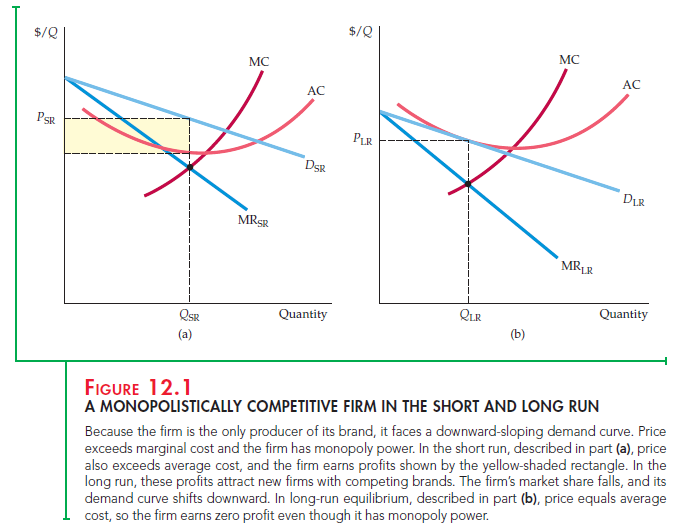
To make this clear, let’s examine the equilibrium price and output level for a monopolistically competitive firm in the short and long run. Figure 12.1(a) shows the short-run equilibrium. Because the firm’s product differs from its competi- tors’, its demand curve DSR is downward sloping. (This is the firm’s demand curve, not the market demand curve, which is more steeply sloped.) The profit- maximizing quantity QSR is found at the intersection of the marginal revenue and marginal cost curves. Because the corresponding price PSR exceeds average cost, the firm earns a profit, as shown by the shaded rectangle in the figure.

In the long run, this profit will induce entry by other firms. As they intro- duce competing brands, our firm will lose market share and sales; its demand curve will shift down, as in Figure 12.1(b). (In the long run, the average and marginal cost curves may also shift. We have assumed for simplicity that costs do not change.) The long-run demand curve DLR will be just tangent to the firm’s average cost curve. Here, profit maximization implies the quantity QLR and the price PLR. It also implies zero profit because price is equal to average cost. Our firm still has monopoly power: Its long-run demand curve is downward slop- ing because its particular brand is still unique. But the entry and competition of other firms have driven its profit to zero.
More generally, firms may have different costs, and some brands will be more distinctive than others. In this case, firms may charge slightly different prices, and some will earn small profits.
3. Monopolistic Competition and Economic Efficiency
Perfectly competitive markets are desirable because they are economically effi- cient: As long as there are no externalities and nothing impedes the workings of the market, the total surplus of consumers and producers is as large as possible. Monopolistic competition is similar to competition in some respects, but is it an efficient market structure? To answer this question, let’s compare the long-run equilibrium of a monopolistically competitive industry to the long-run equilib-rium of a perfectly competitive industry.
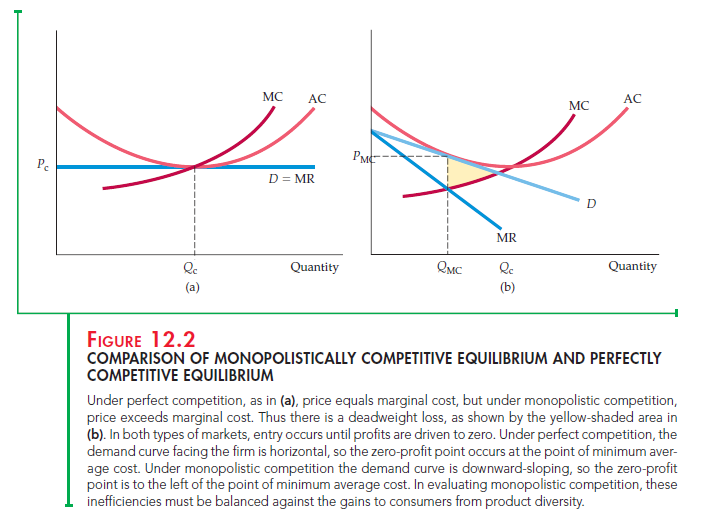
Figure 12.2 shows that there are two sources of inefficiency in a monopolisti-cally competitive industry:
- Unlike perfect competition, with monopolistic competition the equilibri- um price exceeds marginal cost. This means that the value to consumers of additional units of output exceeds the cost of producing those units. If output were expanded to the point where the demand curve intersects the marginal cost curve, total surplus could be increased by an amount equal to the yellow-shaded area in Figure 12.2(b). This should not be surprising. We saw in Chapter 10 that monopoly power creates a deadweight loss, and monopoly power exists in monopolistically competitive markets.
- Note in Figure 12.2(b) that for the monopolistically competitive firm, out- put is below that which minimizes average cost. Entry of new firms drives profits to zero in both perfectly competitive and monopolistically competi- tive markets. In a perfectly competitive market, each firm faces a horizon- tal demand curve, so the zero-profit point occurs at minimum average cost, as Figure 12.2(a) shows. In a monopolistically competitive market, how- ever, the demand curve is downward sloping, so the zero-profit point is to the left of minimum average cost. Excess capacity is inefficient because average cost would be lower with fewer firms.
These inefficiencies make consumers worse off. Is monopolistic competi- tion then a socially undesirable market structure that should be regulated? The answer—for two reasons—is probably no:
- In most monopolistically competitive markets, monopoly power is smaill. Usually enough firms compete, with brands that are sufficiently substitutable, so that no single firm has much monopoly power. Any resulting deadweight loss will therefore be small. And because firms’ demand curves will be fairly elastic, average cost will be close to the minimum.

2. Any inefficiency must be balanced against an important benefit from monopolistic competition: product diversity. Most consumers value the ability to choose among a wide variety of competing products and brands that differ in various ways. The gains from product diversity can be large and may easily outweigh the inefficiency costs resulting from downward- sloping demand curves
Source: Pindyck Robert, Rubinfeld Daniel (2012), Microeconomics, Pearson, 8th edition.

Some truly good blog posts on this website , appreciate it for contribution.