So far, we have assumed that people’s demands for a good are independent of one another. In other words, Tom’s demand for coffee depends on Tom’s tastes and income, the price of coffee, and perhaps the price of tea. But it does not depend on Dick’s or Harry’s demand for coffee. This assumption has enabled us to obtain the market demand curve simply by summing individuals’ demands.
For some goods, however, one person’s demand also depends on the demands of other people. In particular, a person’s demand may be affected by the number of other people who have purchased the good. If this is the case, there exists a network externality. Network externalities can be positive or neg- ative. A positive network externality exists if the quantity of a good demanded by a typical consumer increases in response to the growth in purchases of other consumers. If the quantity demanded decreases, there is a negative network externality.
1. Positive Network Externalities
One example of a positive network externality is word processing. Many students use Microsoft Word in part because their friends and many of their professors do as well. That allows us to send and receive drafts without the need to convert from one program to another. The more people use a particular prod- uct or participate in a particular activity, the greater the intrinsic value of that activity or product to each individual.
Social network websites provide another good example. If I am the only member of that site, it will have no value to me. But the greater number of people who join the site, the more valuable it will become. If one social network- ing site has a small advantage in terms of market share early on, the advantage will grow, because new members will prefer to join the larger site. Hence the huge success of personal website Facebook and professional website LinkedIn. A similar story holds for virtual worlds and for multiplayer online games.
Another example of a positive network externality is the bandwagon effect— the desire to be in style, to possess a good because almost everyone else has it, or to indulge a fad. The bandwagon effect often arises with children’s toys (video games, for example). In fact, exploiting this effect is a major objective in market- ing and advertising toys. Often it is the key to success in selling clothing.
Positive network externalities are illustrated in Figure 4.17, in which the hori- zontal axis measures the sales of a product in thousands per month. Suppose con- sumers think that only 20,000 people have purchased a certain product. Because this is a small number relative to the total population, consumers will have little incentive to buy the product. Some consumers may still buy it (depending on price), but only for its intrinsic value. In this case demand is given by the curve D20. (This hypothetical demand curve assumes that there are no externalities.)
Suppose instead that consumers think 40,000 people have bought the prod-uct. Now they find it more attractive and want to buy more. The demand curve is D40, which is to the right of D20. Similarly, if consumers think that 60,000 peo- ple have bought the product, the demand curve will be D60, and so on. The more people consumers believe to have purchased the product, the farther to the right the demand curve shifts.
Ultimately, consumers will get a good sense of how many people have in fact purchased a product. This number will depend, of course, on its price. In Figure 4.17, for example, we see that if the price were $30, then 40,000 people would buy the product. Thus the relevant demand curve would be D40. If the price were $20, 80,000 people would buy the product and the relevant demand curve would be D80. The market demand curve is therefore found by joining the points on the curves D20, D40, D60, D80, and D100 that correspond to the quantities 20,000, 40,000, 60,000, 80,000 and 100,000.
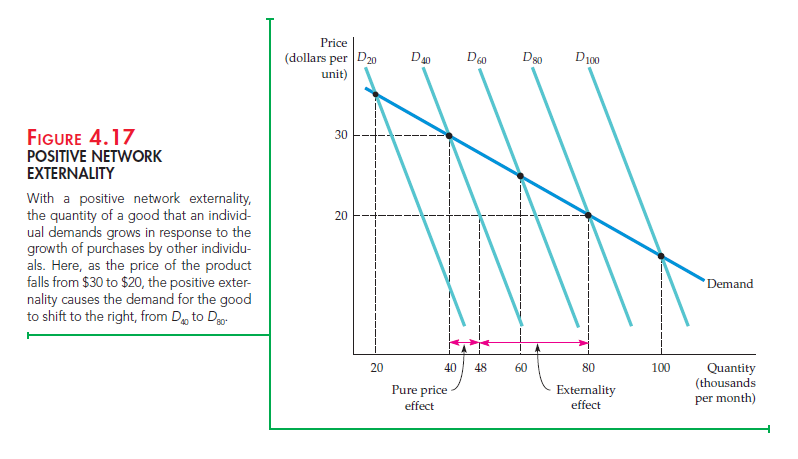
Compared with the curves D20, etc., the market demand curve is relatively elastic. To see why the positive externality leads to a more elastic demand curve, consider the effect of a drop in price from $30 to $20, with a demand curve of D40. If there were no externality, the quantity demanded would increase from 40,000 to only 48,000. But as more people buy the product, the positive network externality increases the quan- tity demanded further, to 80,000. Thus, the positive network externality increases the response of demand to price changes—i.e., it makes demand more elastic. As we’ll see later, this result has important implications for producers’ pricing strategies.
2. Negative Network Externalities
Network externalities are sometimes negative. Congestion offers one example. When skiing, I prefer short lines at ski lifts and fewer skiers on the slopes. As a result, the value of a lift ticket at a ski resort is lower the more people who bought the tickets. Likewise for entry to an amusement park, skating rink, or beach.
Another example of a negative network externality is the snob effect—the desire to own an exclusive or unique good. The quantity demanded of a “snob good” is higher the fewer people who own it. Rare works of art, specially designed sports cars, and made-to-order clothing are snob goods. The value one gets from a painting or a sports car is partly the prestige, status, and exclusivity resulting from the fact that few other people own one like it.
Figure 4.18 illustrates how a negative network externality works. We will assume that the product in question is a snob good, so people value exclusivity.
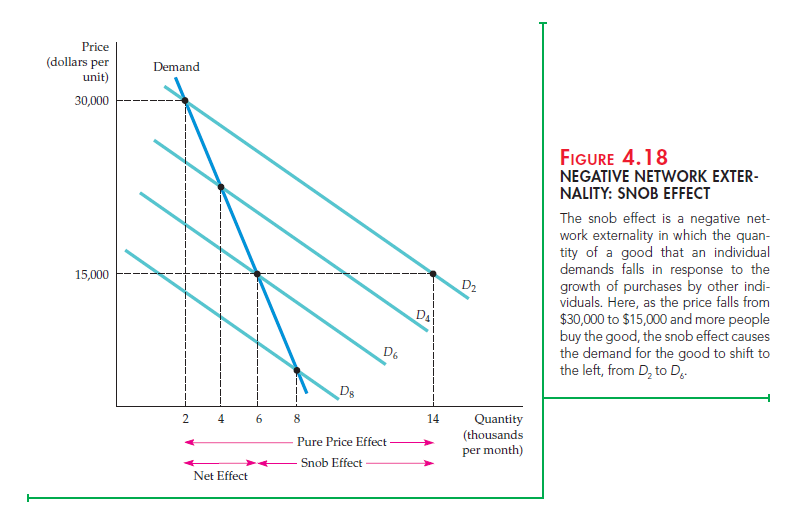
In the figure, D2 is the demand curve that would apply if consumer believed that only 2000 people used the good. If they believe that 4000 people use the good, it would be less exclusive, and so its value decreases. The quantity demanded will therefore be lower; curve D4 applies. Similarly, if consumers believe that 6000 people use the good, demand is even smaller and D6 applies. Eventually, con- sumers learn how widely owned the good actually is. Thus, the market demand curve is found by joining the points on curves D2, D4, D6, etc., that actually cor- respond to the quantities 2000, 4000, 6000, etc.
Note that the negative network externality makes market demand less elastic. To see why, suppose the price was initially $30,000 with 2000 peo- ple using the good. What happens when the price is lowered to $15,000? If there were no externality, the quantity purchased would increase to 14,000 (along curve D2). But the value of the good is greatly reduced if more people own it. The negative network externality dampens the increase in the quan- tity demanded, cutting it by 8000 units; the net increase in sales is only to 6000 units.
For a variety of goods, marketing and advertising are geared to creating a snob effect. (Think of Rolex watches.) The goal is a very inelastic demand—which makes it possible for firms to charge very high prices. Negative network externalities can arise for other reasons. Consider the effect of congestion in queues. Because I prefer short lines and fewer skiers on the slopes, the value I obtain from a lift ticket at a ski resort is lower the more people there are who have bought tickets. Likewise for entry to an amusement park, skating rink, or beach.
Source: Pindyck Robert, Rubinfeld Daniel (2012), Microeconomics, Pearson, 8th edition.
I do not even understand how I stopped up here, but I assumed this publish used to be great. I do not understand who you might be but certainly you are going to a famous blogger when you aren’t already 😉 Cheers!