1. Research Problems
The research process begins with an issue or problem of interest to the researcher. This research problem is a statement that asks about the relationships between two or more variables.1 Almost all research studies have more than two variables. Appendix B provides templates to help you phrase your research problem, and provides examples from the expanded high school and beyond (HSB) data set that is described in this chapter and used throughout the book.
The process of moving from a sense of curiosity, or a feeling that there is an unresolved problem to a clearly defined, researchable problem, can be a complex and long one. That part of the research process is beyond the scope of this book, but it is discussed in most books about research methods and books about completing a dissertation or thesis.
2. Variables
Key elements in a research problem are the variables. A variable is defined as a characteristic of the participants or situation in a given study that has different values. A variable must vary or have different values in the study. For example, gender can be a variable because it has two values, female or male. Age is a variable that can have a large number of values. Type of treatment/intervention (or type of curriculum) is a variable if there is more than one treatment or a treatment and a control group. The number of days to learn something or to recover from an ailment are common measures of the effect of a treatment and, thus, are also potential variables. Similarly, amount of mathematics knowledge can be a variable because it can vary from none to a lot.
However, even if a characteristic has the potential to be a variable, if it has only one value in a particular study, it is not a variable; it is a constant. Thus, ethnic group is not a variable if all participants in the study are European American. Gender is not a variable if all participants in a study are female.
In quantitative research, variables are defined operationally and are commonly divided into independent variables (active or attribute), dependent variables, and extraneous variables. Each of these topics is dealt with briefly in the following sections.
Operational Definitions of Variables
An operational definition describes or defines a variable in terms of the operations or techniques used to make it happen or measure it. When quantitative researchers describe the variables in their study, they specify what they mean by demonstrating how they measured the variable. [1] Demographic variables like age, gender, or ethnic group are usually measured simply by asking the participant to choose the appropriate category from a list.
Types of treatment (or curriculum) are usually operationally defined much more extensively by describing what was done during the treatment or new curriculum. Likewise, abstract concepts like mathematics knowledge, self-concept, or mathematics anxiety need to be defined operationally by spelling out in some detail how they were measured in a particular study. To do this, the investigator may provide sample questions, append the actual instrument, or provide a reference where more information can be found.
Independent Variables
There are two types of independent variables, active and attribute. It is important to distinguish between these types when we discuss the results of a study. As presented in more detail later, an active independent variable is a necessary but not sufficient condition to make cause and effect conclusions.
Active or manipulated independent variables. An active independent variable is a variable, such as a workshop, new curriculum, or other intervention, at least one level of which is given to a group of participants, within a specified period of time during the study.
For example, a researcher might investigate a new kind of therapy compared to the traditional treatment. A second example might be to study the effect of a new teaching method, such as cooperative learning, compared to independent learning. In these two examples, the variable of interest is something that is given to the participants. Thus, active independent variables are given to the participants in the study but are not necessarily given or manipulated by the experimenter. They may be given by a clinic, school, or someone other than the investigator, but from the participants’ point of view, the situation is manipulated. To be considered an active independent variable, the treatment should be given after the study is planned so that there could be a pretest. Other writers have similar but, perhaps, slightly different definitions of active independent variables. Randomized experimental and quasi-experimental studies have an active independent variable.
Attribute or measured independent variables. An independent variable that cannot be manipulated, yet is a major focus of the study, can be called an attribute independent variable. In other words, the values of the independent variable are preexisting attributes of the persons or their ongoing environment that are not systematically changed during the study. For example, level of parental education, socioeconomic status, gender, age, ethnic group, IQ, and self-esteem are attribute variables that could be used as attribute independent variables. Studies with only attribute independent variables are called nonexperimental studies.
Unlike authors of some research methods books, we do not restrict the term independent variable to those variables that are manipulated or active. We define an independent variable more broadly to include any predictors, antecedents, or presumed causes or influences under investigation in the study. Attributes of the participants as well as active independent variables fit within this definition. For the social sciences and education, attribute independent variables are especially important. Type of disability or level of disability may be the major focus of a study. Disability certainly qualifies as a variable because it can take on different values even though they are not given during the study. For example, cerebral palsy is different from Down syndrome, which is different from spina bifida, yet all are disabilities. Also, there are different levels of the same disability. People already have defining characteristics or attributes that place them into one of two or more categories. The different disabilities are characteristics of the participants before we begin our study. Thus, we might also be interested in studying how variables that are not given or manipulated during the study, even by other persons, schools, or clinics, predict various other variables that are of interest.
Other labels for the independent variable. SPSS uses a variety of terms, such as factor (Chapter 10) and grouping variable (Chapter 9), for the independent variables. In other cases, (Chapters 7 and 8) the program and statisticians do not make a distinction between the independent and dependent variable; they just label them variables. For example, technically there is no independent variable for a correlation or chi-square. Even for chi-square and correlation, we think it is sometimes conceptually useful to think of one variable as the predictor (independent variable) and the other as the outcome (dependent variable); however, it is important to realize that the statistical tests of correlation and chi-square treat both variables in the same way, rather than treating one as a predictor and one as an outcome variable, as is the case in regression.
Type of independent variable and inferences about cause and effect. When we analyze data from a research study, the statistical analysis does not differentiate whether the independent variable is an active independent variable or an attribute independent variable. However, even though most statistics books use the label independent variable for both active and attribute variables, there is a crucial difference in interpretation.
A major goal of scientific research is to be able to identify a causal relationship between two variables. For those in applied disciplines, the need to demonstrate that a given intervention or treatment causes a change in behavior or performance can be extremely important. Only the approaches that have an active independent variable (randomized experimental and, to a lesser extent, quasi-experimental) can provide data that allow one to infer that the independent variable caused the change or difference in the dependent variable.
In contrast, a significant difference between or among persons with different values of an attribute independent variable should not lead one to conclude that the attribute independent variable caused the dependent variable to change. Thus, this distinction between active and attribute independent variables is important because terms such as main effect and effect size used by the program and most statistics books might lead one to believe that if you find a significant difference, the independent variable caused the difference. These terms can be misleading when the independent variable is an attribute.
Although nonexperimental studies (those with attribute independent variables) are limited in what can be said about causation, they can lead to solid conclusions about the differences between groups and about associations between variables. Furthermore, if the focus of your research is on attribute independent variables, a nonexperimental study is the only available approach. For example, if you are interested in learning how boys and girls learn mathematical concepts, you are interested in the attribute independent variable of gender.
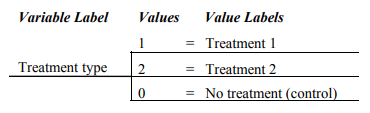
Values of the independent variable. SPSS uses the term values to describe the several options or categories of a variable. These values are not necessarily ordered, and several other terms, categories, levels, groups, or samples, are sometimes used interchangeably with the term values, especially in statistics books. Suppose that an investigator is performing a study to investigate the effect of a treatment. One group of participants is assigned to the treatment group. A second group does not receive the treatment. The study could be conceptualized as having one independent variable (treatment type), with two values or levels (treatment and no treatment). The independent variable in this example would be classified as an active independent variable. Now, suppose instead that the investigator was interested primarily in comparing two different treatments but decided to include a third no-treatment group as a control group in the study. The study would still be conceptualized as having one active independent variable (treatment type), but with three values or levels (the two treatment conditions and the control condition). This variable could be diagrammed as follows:
As an additional example, consider gender, which is an attribute independent variable with two values, male and female. It could be diagrammed as follows:
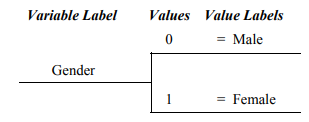
Note that in this program each variable is given a variable label; moreover, the values, which are often categories, have value labels (e.g., male and female). Each value or level is assigned a number used to compute statistics. It is especially important to know the value labels when the variable is nominal, that is, when the values of the variable are just names and thus are not ordered.
Dependent Variables
The dependent variable is assumed to measure or assess the effect of the independent variable. It is thought of as the presumed outcome or criterion. Dependent variables are often test scores, ratings on questionnaires, readings from instruments (e.g., electrocardiogram, galvanic skin response, etc.), or measures of physical performance. When we discuss measurement in Chapters 2 and 3, we are usually referring to the dependent variable. Dependent variables, like independent variables, must have at least two values; most of the dependent variables used in this book have many values, varying from low to high so they are not as easy to diagram as the independent variables shown earlier.
SPSS also uses a number of other terms for the dependent variable. Dependent list is used in cases where you can do the same statistic several times for a list of dependent variables (e.g., in Chapter 10 with one-way ANOVA). The term test variable is used in Chapter 9 for the dependent variable in a t test.
Extraneous Variables
These are variables (also called nuisance variables or, in some designs, covariates) that are not of interest in a particular study but could influence the dependent variable. Environmental factors (e.g., temperature or distractions), time of day, and characteristics of the experimenter, teacher, or therapist are some possible extraneous variables that need to be controlled. SPSS does not use the term extraneous variable. However, sometimes such variables are “controlled” using statistics that are available in this program.
[1] To help you, we have identified the variable names, labels, and values using italics (e.g., gender and male) and have put in bold the terms used in the windows and outputs (e.g., Data Editor), and we use bold for other key terms when they are introduced, defined, or are important to understanding. Underlines are used to focus your attention on critical points or phrases that could be missed. Italics are also used, as is commonly the case, for emphasizing words and for the titles of books.
Source: Morgan George A, Leech Nancy L., Gloeckner Gene W., Barrett Karen C.
(2012), IBM SPSS for Introductory Statistics: Use and Interpretation, Routledge; 5th edition; download Datasets and Materials.
19 Sep 2022
29 Mar 2023
30 Mar 2023
29 Mar 2023
28 Mar 2023
15 Sep 2022