Let’s assume that education levels and visualization test scores are not normally distributed and/or other assumptions of the paired t test are violated. In fact, mother’s education was quite skewed (see Chapter 4). Let’s run the Wilcoxon signed-ranks nonparametric test to see if fathers have significantly higher educational levels than the mothers and to see if the visualization test is significantly different from the visualization retest. The assumptions of the Wilcoxon tests are similar to those for the Mann-Whitney test.
- (a) Are mother’s and father’s education levels significantly different? (b) Are the visualization and visualization retest scores different?
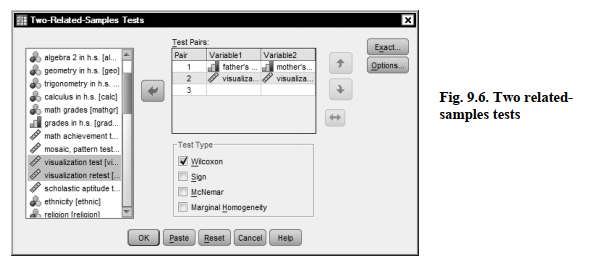
- To answer these questions, select Analyze → Nonparametric Tests → Legacy Dialogs → 2 Related Samples…
- Highlight father’s education and mother’s education and move them into the Test Pairs: Then, highlight visualization test and visualization retest and move them into the box.
- Ensure that Wilcoxon is checked in the Test Type dialog box. (See Fig. 9.6.)
- Click on
Compare your syntax and output to Output 9.6.
Output 9.6: Wilcoxon Nonparametric Test
NPAR TEST
/WILCOXON=faed visual WITH maed visual2 (PAIRED)
/MISSING ANALYSIS.
NPar Tests
Wilcoxon Signed Ranks Test
Interpretation of Output 9.6
Output 9.6 shows the nonparametric (Wilcoxon) analyses, which are similar to the paired t tests.
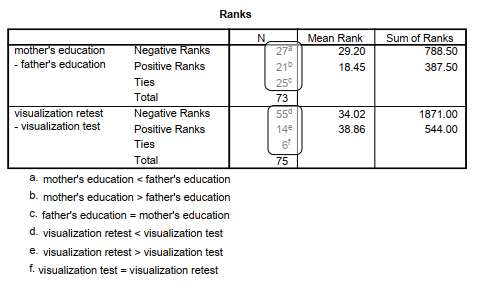
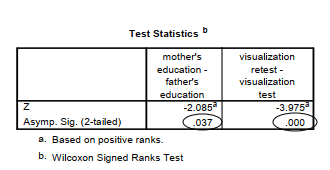
Note that the first table shows not only the mean ranks, but also the number of students whose mothers, for example, had less education than their fathers (27). Note that there were lots of ties (25) and almost as many women (21) that have more education than their husbands. However, overall the fathers had more education, as indicated by their lower mean rank (18.45) and the significant z (p = .037). The second table shows the significance level for the two tests. Note that the p or sig. values are quite similar to those for the paired t tests. Effect size measures are not
provided on the output, but again we can compute an r from the z scores and Ns (Total) that are
shown in Output 9.6 using the same formula as for Problem 9.3 r = -.24 (i.e., -2.085/8.54) for the comparison of mothers’ and fathers’ education, which is a small to medium effect size. For the comparison of the visualization and visualization retest, r = .46, a large effect size. Note that 55 students had higher visualization test scores while only 14 had higher visualization retest scores.
How to Write About Output 9.6
Results
Wilcoxon signed ranks tests were used to compare the education of each student’s mother and father. Of 73 students, 27 fathers had more education, 21 mothers had more education, and there were 25 ties. This difference indicating more education for fathers is significant, z = 2.09, p = .037, r = -.24, a small to medium effect size. Similarly, the visualization test scores were significantly higher than the visualization retest scores, N = 75, z = 3.98, p < .001, r = -.46, a large effect according to Cohen (1988).
Source: Morgan George A, Leech Nancy L., Gloeckner Gene W., Barrett Karen C.
(2012), IBM SPSS for Introductory Statistics: Use and Interpretation, Routledge; 5th edition; download Datasets and Materials.
17 Sep 2022
14 Sep 2022
14 Sep 2022
27 Mar 2023
15 Sep 2022
22 Sep 2022