Quality Control (QC) may be defined as a system that is used to maintain a desired level of quality in a product or service. It is a systematic control of various factors that affect the quality of the product. It depends on materials, tools, machines, type of labour, working conditions etc.
QC is a broad term, it involves inspection at particular stage but mere inspection does not mean QC. As opposed to inspection, in quality control activity emphasis is placed on the quality future production. Quality control aims at prevention of defects at the source, relies on effective feedback system and corrective action procedure. Quality control uses inspection as a valuable tool.
According to Juran “Quality control is the regulatory process through which we measure actual quality performance, compare it with standards, and act on the difference”. Another definition of quality control is from ANSI/ASQC standard (1978) quality control is defined as “The operational techniques and the activities which sustain a quality of product or service that will satisfy given needs; also the use of such techniques and activities”.
Alford and Beatty define QC as “In the broad sense, quality control is the mechanism by which products are made to measure up to specifications determined from customers, demands and transformed into sales engineering and manufacturing requirements, it is concerned with making things right rather than discovering and rejecting those made wrong”.
1. Types of Quality Control
QC is not a function of any single department or a person. It is the primary responsibility of any supervisor to turn out work of acceptable quality. Quality control can be divided into three main sub-areas, those are:
- Off-line quality control: Its procedure deal with measures to select and choose controllable product and process parameters in such a way that the deviation between the product or process output and the standard will be minimized. Much of this task is accomplished through product and process design.
Example: Taguchi method, principles of experimental design etc.
- Statistical process control: SPC involves comparing the output of a process or a service with a standard and taking remedial actions in case of a discrepancy between the two. It also involves determining whether a process can produce a product that meets desired specification or requirements. On-line SPC means that information is gathered about the product, process, or service while it is functional. The corrective action is taken in that operational phase. This is real-time basis.
- Acceptance sampling plans: A plan that determines the number of items to sample and the acceptance criteria of the lot, based on meeting certain stipulated conditions (such as the risk of rejecting a good lot or accepting a bad lot) is known as an acceptance sampling plan.
2. Steps in Quality Control
Following are the steps in quality control process:
- Formulate quality policy.
- Set the standards or specifications on the basis of customer’s preference, cost and profit.
- Select inspection plan and set up procedure for checking.
- Detect deviations from set standards of specifications.
- Take corrective actions or necessary changes to achieve standards.
- Decide on salvage method e., to decide how the defective parts are disposed of, entire scrap or rework.
- Coordination of quality problems.
- Developing quality consciousness both within and outside the organization.
- Developing procedures for good vendor-vendee relations.
3. Objectives of Quality Control
Following are the objectives of quality control:
- To improve the companies income by making the production more acceptable to the customers, e., by providing long life, greater usefulness, maintainability etc.
- To reduce companies cost through reduction of losses due to defects.
- To achieve interchangeability of manufacture in large scale production.
- To produce optimal quality at reduced price.
- To ensure satisfaction of customers with productions or services or high quality level, to build customer goodwill, confidence and reputation of manufacturer.
- To make inspection prompt to ensure quality control.
- To check the variation during manufacturing.
The broad areas of application of quality control are incoming material control, process control and product control.
4. Benefits of Quality Control
- Improving the quality of products and services.
- Increasing the productivity of manufacturing processes, commercial business, corporations.
- Reducing manufacturing and corporate costs.
- Determining and improving the marketability of products and services.
- Reducing consumer prices of products and services.
- Improving and/or assuring on time deliveries and availability.
- Assisting in the management of an enterprise.
5. Seven Tools for Quality Control
To make rational decisions using data obtained on the product, or process, or from the consumer, organizations use certain graphical tools. These methods help us learn about the characteristics of a process, its operating state of affairs and the kind of output we may expect from it. Graphical methods are easy to understand and provide comprehensive information; they are a viable tool for the analysis of product and process data. These tools are effect on quality improvement. The seven quality control tools are:
- Pareto charts
- Check sheets
- Cause and effect diagram
- Scatter diagrams
- Histogram
- Graphs or flow charts
- Control charts
5.1. Pareto Charts
Pareto charts help prioritize by arranging them in decreasing order of importantce. In an environment of limited resources these diagrams help companies to decide on the order in which they should address problems. The Pareto analysis can be used to identify the problem in a number of forms.
- Analysis of losses by material (number or past number).
- Analysis of losses by process e., classification of defects or lot rejections in terms of the process.
- Analysis of losses by product family.
- Analysis by supplier across the entire spectrum of purchases.
- Analysis by cost of the parts. f Analysis by failure mode.
Example: The Fig. 6.1 shows a Pareto chart of reasons for poor quality. Poor design will be the major reason, as indicated by 64%. Thus, this is the problem that the manufacturing unit should address first.
A — Poor Design
B — Defective Parts
C — Operator Error
D — Wrong Dimensions
E — Surface Abrasion
F — Machine Calibrations
G — Defective Material
5.2. Check Sheets
Check sheets facilitate systematic record keeping or data collection observations are recorded as they happen which reveals patterns or trends. Data collection through the use of a checklist is often the first step in analysis of quality problem. A checklist is a form used to record the frequency of occurrence of certain product or service characteristics related to quality. The characteristics may be measurable on a continuous scale such as weight, diameter, time or length.

Example: The table is a check sheet for an organization’s computer related problems.

5.3. Cause and Effect Diagram
It is sometimes called as Fish-bone diagram. It is first developed by Kaorv Ishikawa in 1943 and is sometimes called as Ishikawa diagram. The diameter helps the management trace customer complaints directly to the operations involved. The main quality problem is referred to Fish-head; the major categories of potential cause structural bones and the likely specific causes to ribs. It explores possible causes of problems, with the intention being to discover the root causes. This diagram helps identify possible reasons for a process to go out of control as well as possible effects on the process.

4. Scatter Diagram (Scatter Plots)
It often indicates the relationship between two variables. They are often used as follow-ups to a cause and effect analysis to determine whether a stated cause truly does impact the quality characteristics.

Example: The above figure plots advertising expenditure against company sales and indicates a strong positive relationship between the two variables. As the level of advertising expenditure increases sales tend to increase.
5.5. Histogram (or) Bar Charts
It displays the large amounts of data that are difficult to interpret in their raw form. A histogram summarizes data measured on a continuous scale showing the frequency distribution of some quality characteristics (in statistical terms the central tendency and the dispersion of the data).

Often the mean of the data is indicated on the histogram. A bar chart is a series of bare representing the frequency of occurrence of data characteristics, the bar height indicates the number of times a particular quality characteristic was observed.
5.6. Flow Charts (or) Graphs
It shows the sequence of events in a process. They are used for manufacturing and service operations. Flow charts are often used to diagram operational procedures to simplify the system. They can identify bottlenecks, redundant steps and non-value added activities. A realistic flow chart can be constructed by using the knowledge of the person who are directly involved in the particular process. The flow chart can be identifies where delays can occur.

5.7. Control Charts
It distinguish special causes of variations from common causes of variation. They are used to monitor and control process on an ongoing basis. A typical control chart plots a selected quality characteristic found from sub-group of observations as a function of sample number. Characteristics such as sample average, sample range and sample proportion of non-conforming units are plotted. The centre line on a control chart represents the average value of characteristics being plotted. Two limits know as the upper control limit (UCL) and lower control limit (LCL) are also shown on control charts. These limits are constructed so that if the process is operating under a stable system of chance causes, the problem of an observation falling outside these limits is quite small. Figure 6.7 shows a generalized representation of a control chart.
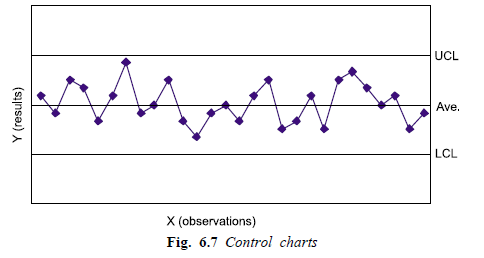
Control chart shows the performance of a process from two points of view. First, they show a snapshot of the process at the moment the data are collected. Second, they show the process trend as time progresses. Process trends are important because they help in identifying the out- of-control status if it actually exists. Also, they help to detect variations outside the normal operational limits, and to identify the cause of variations. Fig. 6.7 shows a generalised representation of a control chart.
6. Causes of Variation in Quality
The variation in the quality of product in any manufacturing process is broadly classified as:
- Chance causes
- Assignable causes.
6.1. Chance Causes
The chance causes are those causes which are inherit in manufacturing process by virtue of operational and constructional features of the equipments involved in a manufacturing process.
This is because of—
- Machine vibrations
- Voltage variations
- Composition variation of material, etc.
They are difficult to trace and difficult to control, even under best condition of production. Even though, it is possible to trace out, it is not economical to eliminate. The chance causes results in only a minute amount of variation in process. Variation in chance causes is due to internal factors only the general pattern of variation under chance causes will follow a stable statistical distribution (normal distribution). Variation within the control limits means only random causes are present.
6.2. Assignable Causes
These are the causes which creates ordinary variation in the production quality.
Assignable cause’s variation can always be traced to a specific quality. They occur due to—
- Lack of skill in operation
- Wrong maintenance practice
- New vendors
- Error in setting jigs and fixtures
- Raw material defects
Variation due to these causes can be controlled before the defective items are produced. Any one assignable cause can result in a large amount of variation in process. If the assignable causes are present, the system will not follow a stable statistical distribution. When the actual variation exceeds the control limits, it is a signal that assignable causes extend the process and process should be investigated.
Source: KumarAnil, Suresh N. (2009), Production and operations management, New Age International Pvt Ltd; 2nd Ed. edition.
Awsome website! I am loving it!! Will come back again. I am taking your feeds also
Hello, Neat post. There is an issue along with your site in internet explorer, could test this… IE nonetheless is the market leader and a big element of folks will pass over your great writing because of this problem.